


Dragon Trail Interactive’s Weibo Rankings Report tracks and analyzes performance for national tourism organizations (NTOs), destination marketing organizations (DMOs), airlines, cruise lines, museums & attractions, and hotels. Like the weekly rankings reports, the quarterly report builds industry benchmarks and uncovers best practices in digital marketing in the travel sector.
In the last quarter of 2020, all six travel sectors showed decreased engagement, but five out of six sectors reached a higher follower base at the end of 2020 relative to Q4 2019. If we know only one thing in this pandemic, it is that people still want to travel. The silver lining here is that the pandemic has allowed us to look deeper into content posted and engagements generated, when heavy promotion is not on the table anymore. In addition to celebrity endorsements, live streaming sessions, and giveaways, the content that proved most efficient in stimulating follower engagement related to destination characteristics, resumed flights, art discoveries, and scenery.
We will look at overall growth of engagement and followers for each travel sector, then briefly go over each sector’s most engaging posts.
Methodology (for the curious minds)
Dragon Trail Interactive tracks Weibo accounts from six travel sectors to gain a deeper perspective on tourism-related account activities. The report is based on public data from 246 accounts, of which 218 were active accounts, collected from the week of 30 December 2019 to 2 January 2021.
After a year of tracking travel sector accounts, we know that posts related to celebrity endorsement and giveaways typically lead to peaks in engagement. However, these peaks are short-lived, and don’t automatically result in healthy follower growth.
In this report, we will also look at engagement rate in each quarter to measure growth in engagement relative to follower base.
Each sector’s total engagement is calculated by aggregating likes, comments, and shares of active accounts. Sector followers are calculated by aggregating each active account’s average followers for the time period. Engagement rate is calculated by dividing total engagements by followers.
2020 overall engagement and follower levels (indexed)
The charts below illustrate engagements and followers for each of the six travel sectors. The starting point is indexed at 100 to better graph the trajectory throughout 2020. A higher than 100 index indicates growth, and vice versa. The index smooths out peaks from promotions and showcases the performance achieved by the end of 2020.
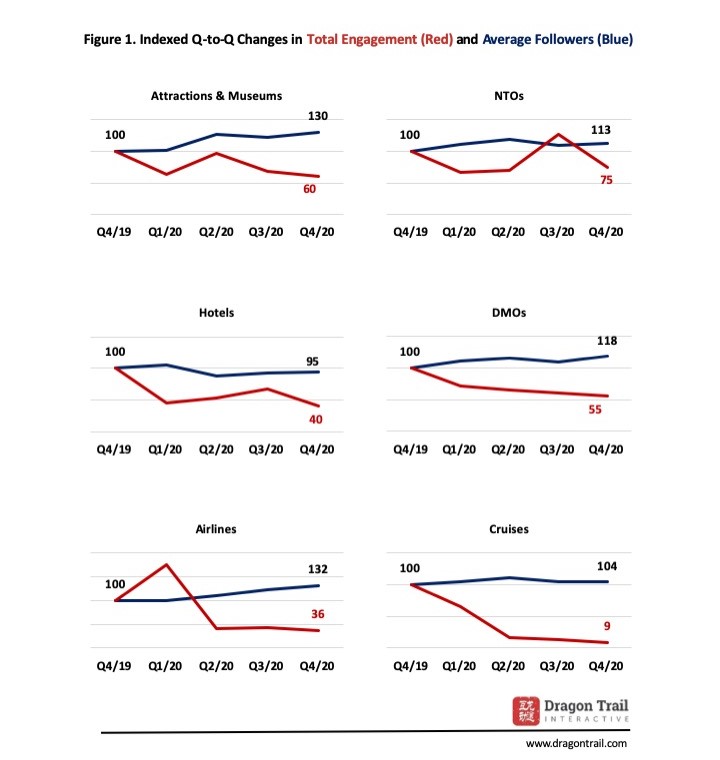
NTOs
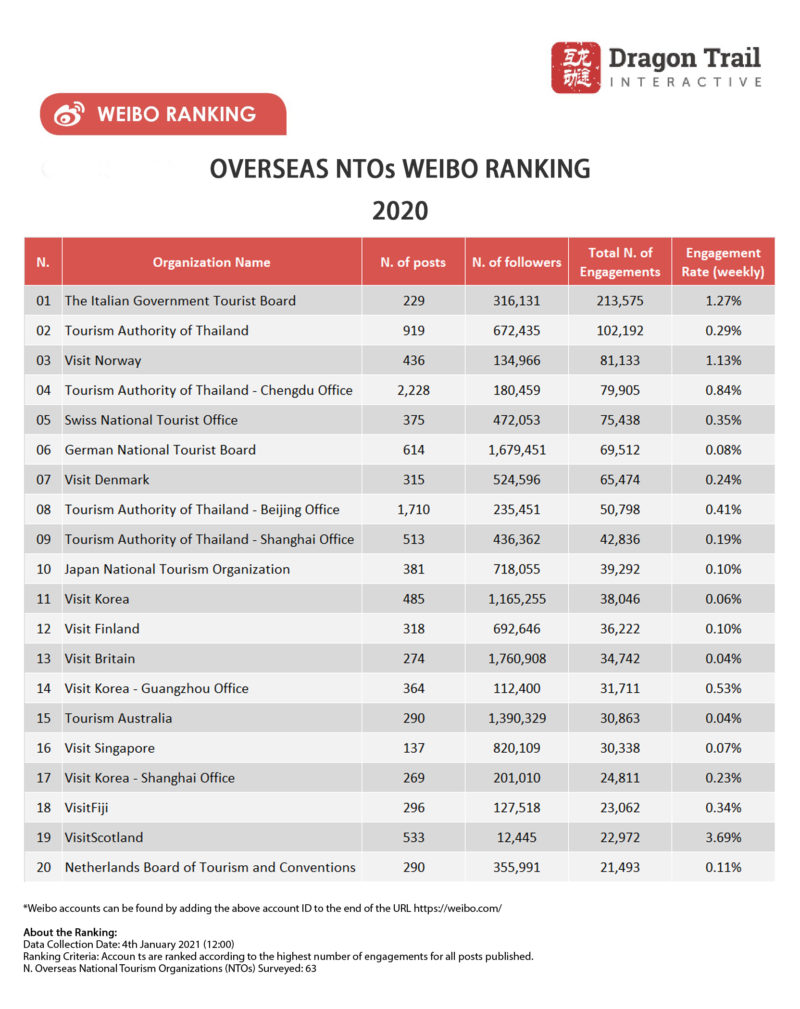
In total, 55 out of 63 NTO accounts tracked were active in 2020. The top 20 accounts (by number of engagements) maintained and increased their follower bases. Engagement saw a boost in Q3 driven by The Italian Government Tourist Board posting about Fu Jing (傅菁), a Chinese singer and actress who was named a “friend to Italian tourism.” This post is most likely promoted through advertising to increase exposure, as later Weibo posts featuring the same celebrity and hashtag did not generate anywhere near the same engagement as this one post, which accounted for over 90% of the Italian tourism board’s total engagements on Weibo in 2020.
NTO accounts came up with creative ideas to engage with followers in 2020. Highly engaging posts include:
– End-of-year Christmas scenes by the Swiss National Tourist Office
– K-Musical On Air by Visit Korea. This series of four live musicals were promoted by Welcome Daehakro, and part of the “cloud travel” trend to allow viewers to enjoy culture, art, and travel from home. The live musicals were available to watch for free and had English subtitles.
– German Kitchen live stream cooking series by the German National Tourist Board
We also noticed many posts showcasing the uniqueness of each destination.
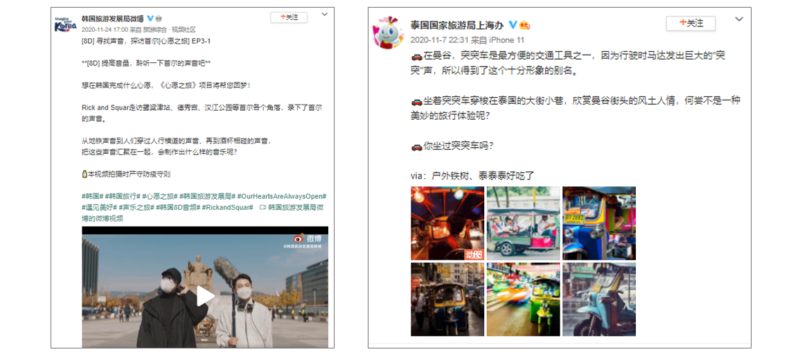
Left: Visit Korea showcasing “Lost in Seoul,” a song recorded by Rick and Squar for the Remote Korea Travel Project. The duo creates music by infusing sounds from daily lives in different parts of Korea. Right: Tourism Authority of Thailand – Shanghai Office showcasing tuk tuks in Bangkok.
DMOs
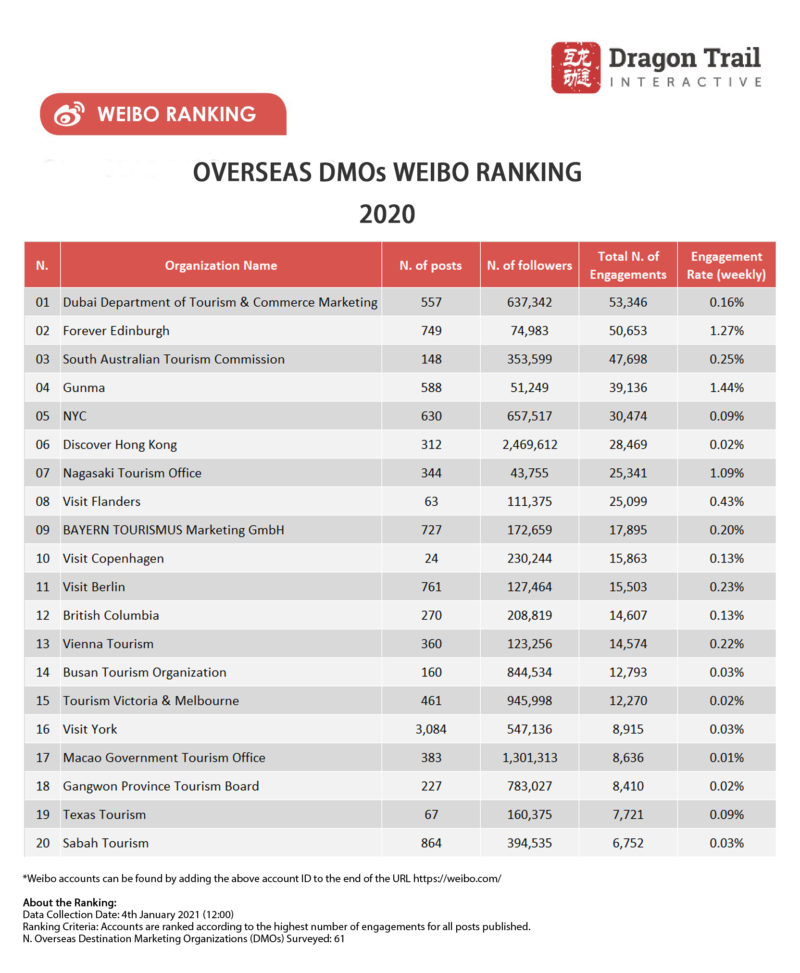
In total, 56 out of 61 DMO accounts were active in 2020. The size of the DMO category’s follower base is second highest among the six travel sectors. However, total engagement in 2020 was second to last.
DMO accounts that kept growing both follower numbers and engagement levels show a pattern of continued engagement in Q3 and Q4. While some accounts paused promotions and others relied on occasional giveaways to drive up engagements, these more successful accounts posted about holiday celebrations and local scenery.
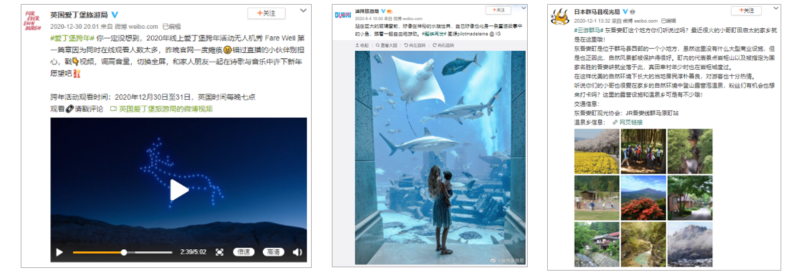
Left to right: Forever Edinburgh online drone display for New Year’s Eve celebrations; Dubai Department of Tourism & Commerce Marketing’s repost of a UCG photo at the Dubai Aquarium; Gunma Prefecture’s promotion of Higashiagatsuma, a town in Gunma and birthplace of actor Keita Machida
Airlines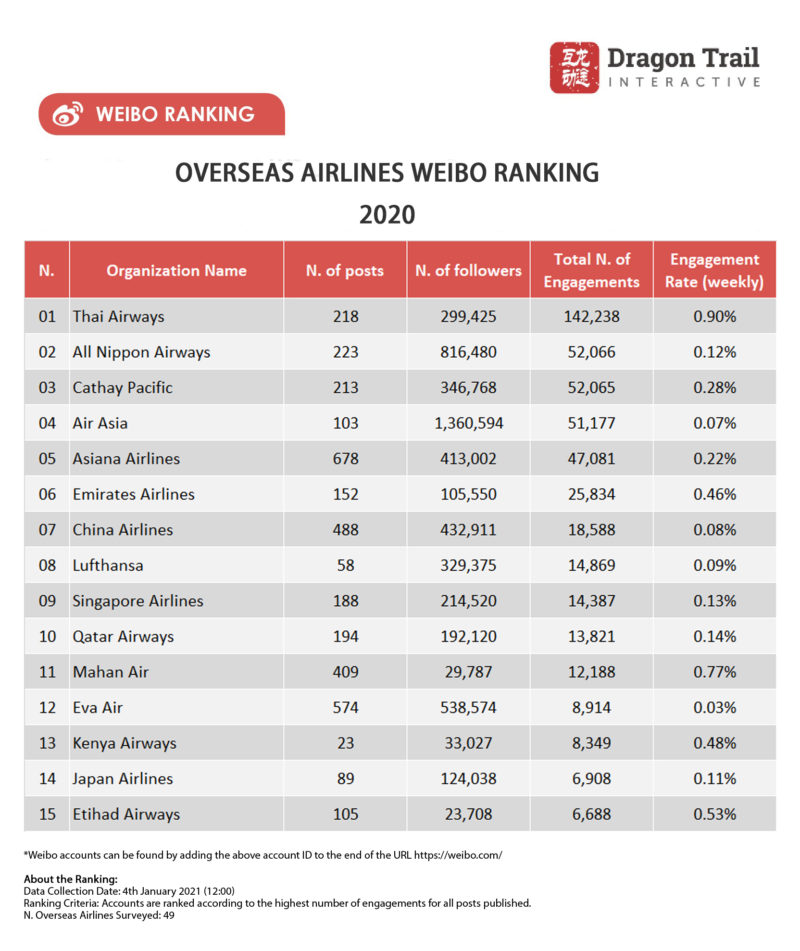
In total, 45 out of 49 airline accounts were active in 2020. In Q1, comments were flooded with cancellation requests in response to travel restrictions put in place by China and other destinations around the world. For the rest of 2020, engagement dropped dramatically and remained low. Despite a shortage of flights available, airline accounts continued to gain followers throughout the year.
Accounts with growing engagement levels tend to update more frequently on resuming routes.
 Left to right: Cathay Pacific on resuming flight transfers through Hong Kong; Asiana Airlines on route updates.
Cruise Lines
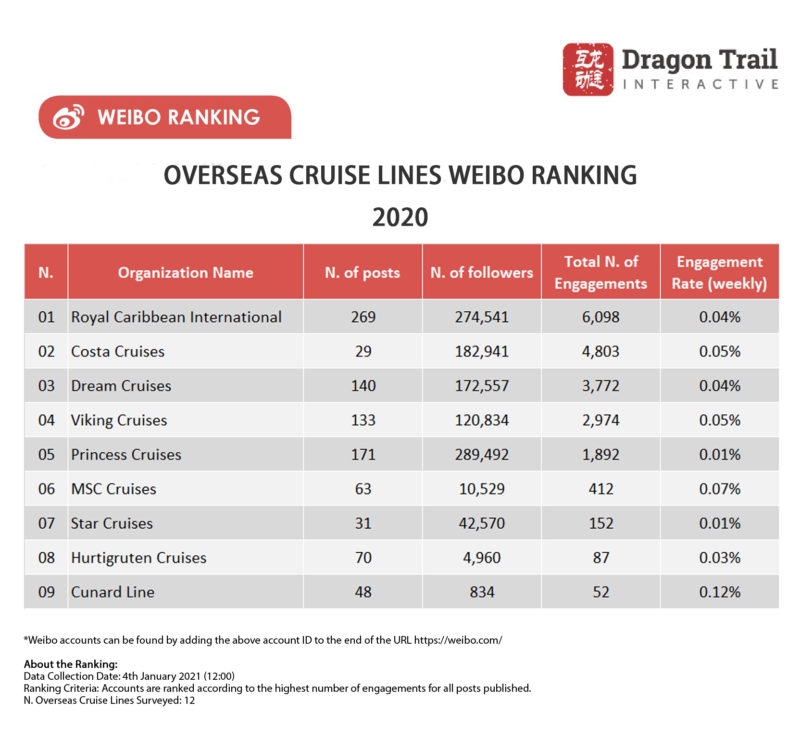
In total, 9 out of 12 cruise accounts were active in 2020. Similar to airlines, cruises were hit with cancellations in Q1, along with comments requesting refunds. Many cruise accounts did not post regularly in 2020.
Despite the low engagement levels in 2020, cruise accounts have maintained a follower base relative to Q4 2019, indicating that their followers are still looking forward to the time when cruise travel can be resumed safely.
Hotels
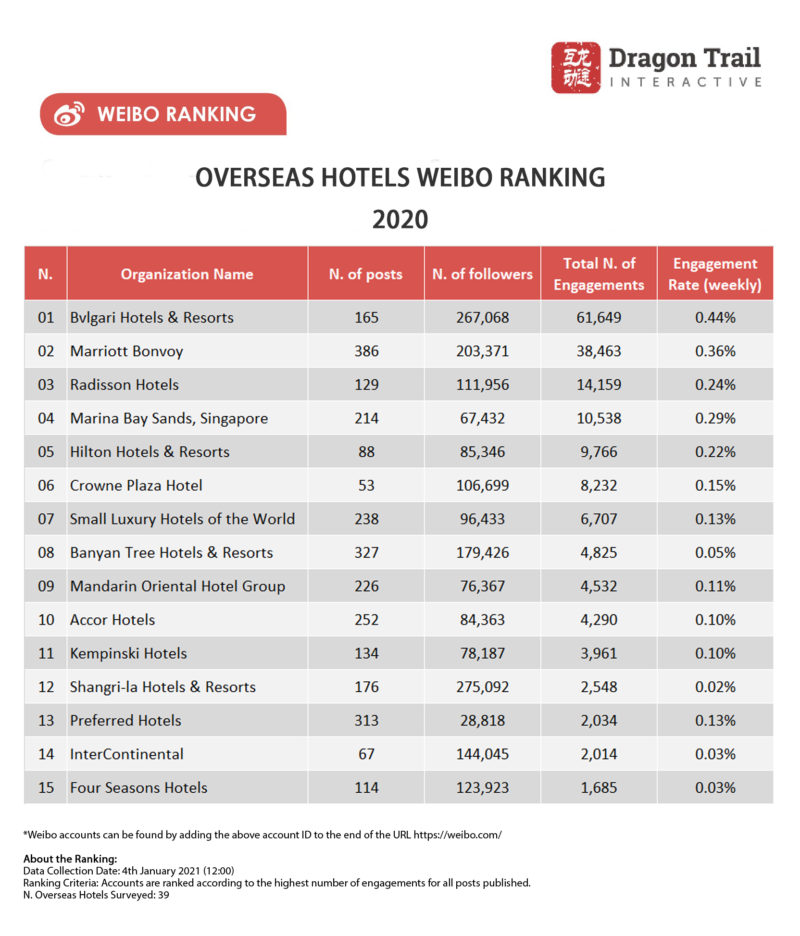
In total, 34 out of 39 hotel accounts were active in 2020. Hotel accounts saw a significant drop in engagements at the end of 2020 compared to the end of 2019. The top 15 accounts managed to maintain and grow followers, despite a drop in the follower base for the hotel category as a whole in 2020.
Most hotel accounts rely on posts related to celebrities, giveaways, and membership benefits to generate engagement. In Q3, hotel accounts saw a slight uptick in engagement, driven by Qixi Festival (Chinese Valentine’s Day) promotions.
Attractions & Museums
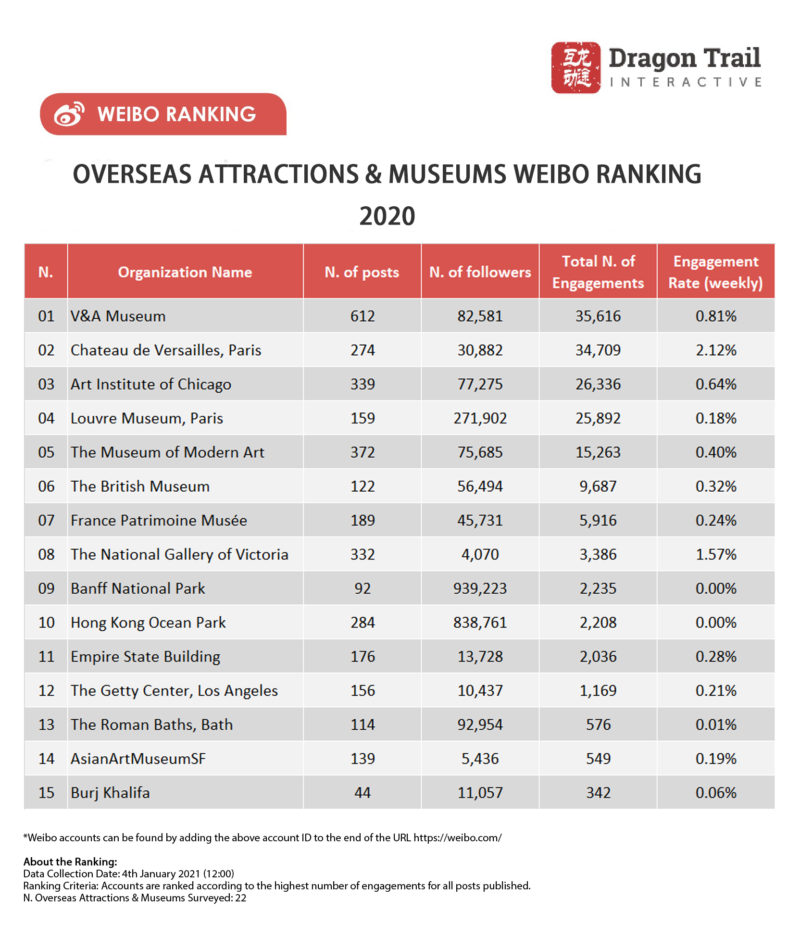
In total, 19 out of 22 attraction and museum accounts were active in 2020. The follower base for the top 15 accounts grew significantly in 2020. The boost of engagement for the category in Q2 was driven by Chateau de Versailles’ first live streaming session, which accounted for over half of all engagements with the account’s content in 2020.
The top posts tended to be videos about new discoveries and posts with pop culture appeal.

Left: Art Institute of Chicago’s video on the attachment of the sculpture of Antinous. Right: V&A Museum’s use of William Morris surface design in Nintendo’s Animal Crossing.
The wonderful partners we work with


Sign up for our free newsletter to keep up to date on our latest news
We do not share your details with any third parties. View our privacy policy.
This website or its third party tools use cookies, which are necessary to its functioning and required to achieve the purposes illustrated in the cookie policy. If you want to know more or withdraw your consent to all or some of the cookies, please refer to the cookie policy. By closing this banner, scrolling this page, clicking a link or continuing to browse otherwise, you agree to the use of cookies.