


Since 2017, Dragon Trail has tracked the weekly activity of overseas tourism boards, airlines, and cruise lines on China’s leading social media platform WeChat, with weekly rankings for museums and attractions, and international hotel brands since 2018. With Chinese outbound travel disrupted by the coronavirus since late January – just as the Chinese New Year holiday period was beginning – 2020 was a very different year from those we’ve analyzed WeChat marketing for in the past.
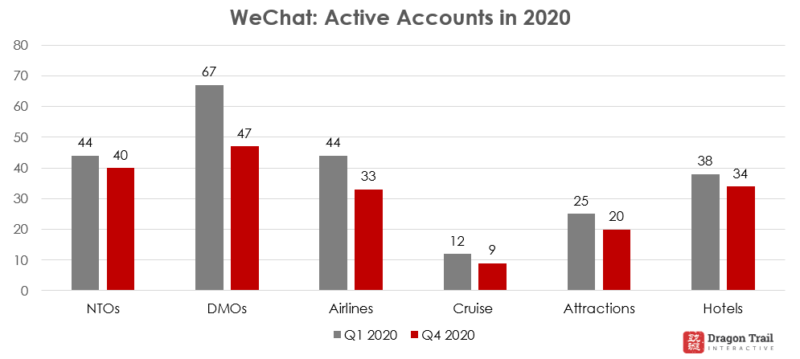
All six account categories experienced a decline in the number of active accounts on WeChat, comparing the first quarter of 2020 to the last. All categories except hotels also decreased the frequency and volume of content throughout the year.
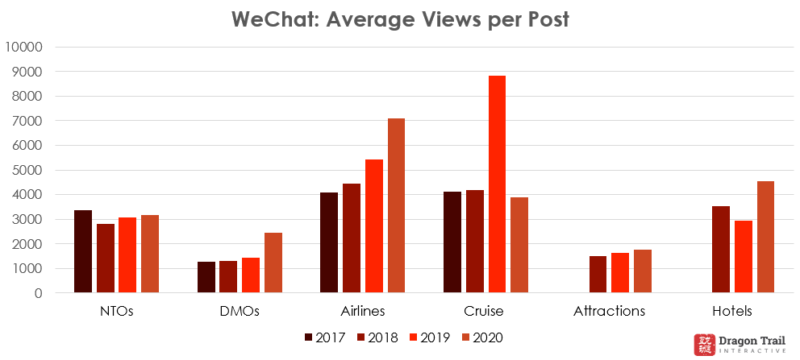
But for accounts such as destinations and museums that promoted interesting content that followers could engage with even if they could not travel, average views per post actually grew modestly in 2020. For airlines, viewership soared in 2020 as content for the most part shifted away from promotions and was replaced by practical information – showing WeChat’s value as a communications platform. Cruise lines saw the worst performance by far, with a major fall in views after the early days of the crisis. Hotels that had properties in China, on the other hand, picked themselves up quickly and had a strong year for promotions, helping to drive domestic tourism recovery.
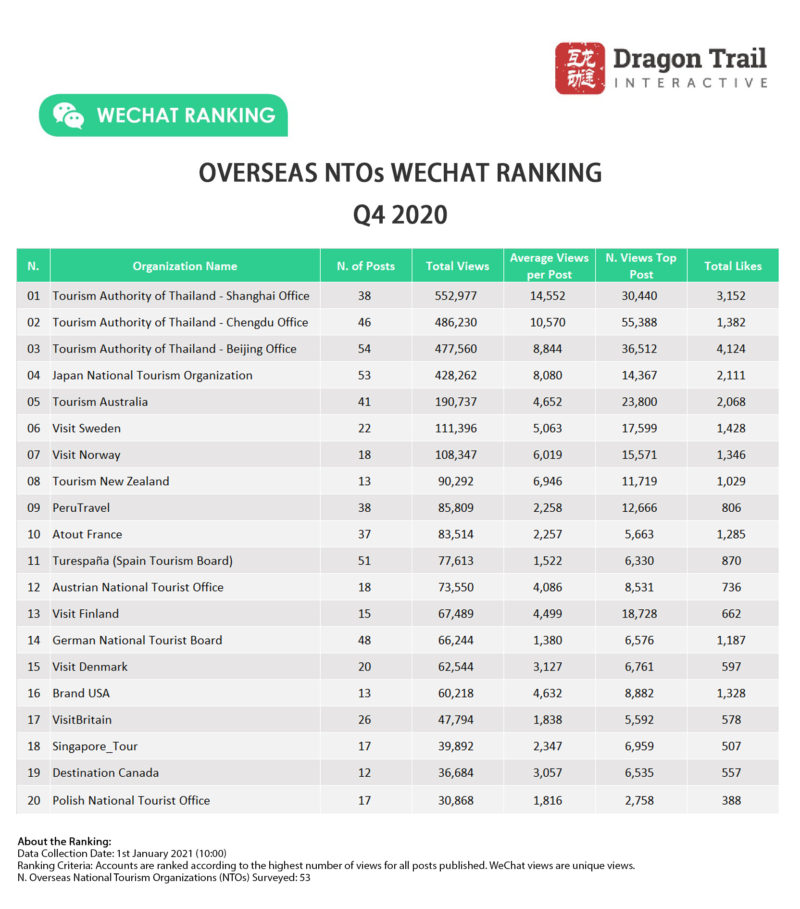
NTOs
Average views per post for NTO content were actually up for the full year and for Q4 compared to 2019 numbers, but there’s a very wide range within the category.
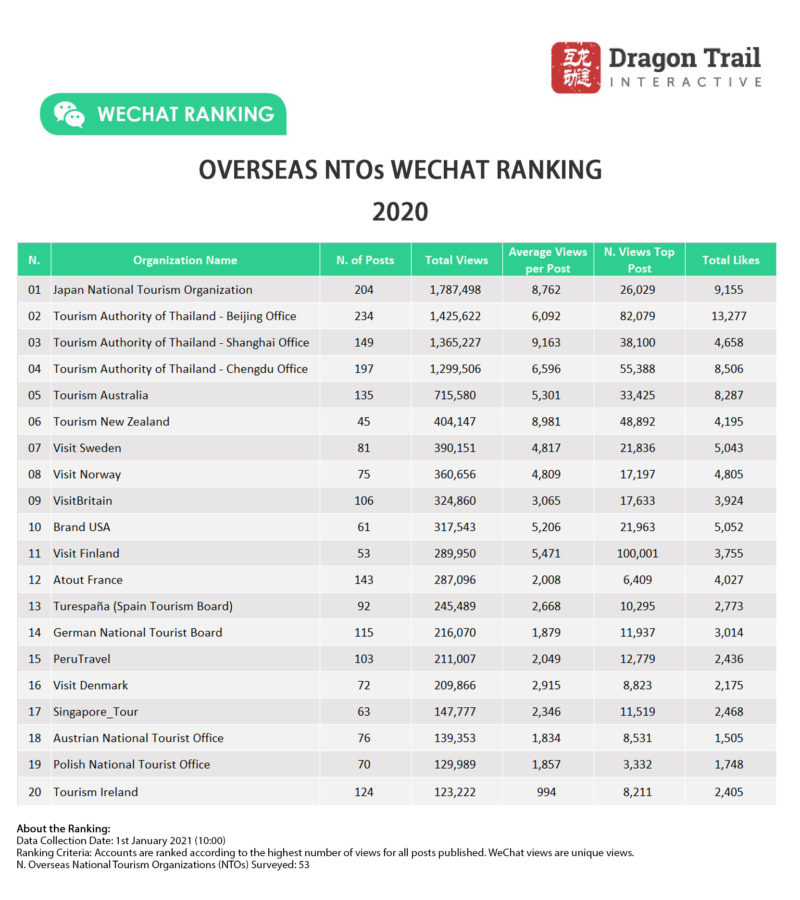
Japan still ranked in first place by total views for national tourism boards for the year, but without such a strong lead. In 2019, Japan had 111% more article views than the no. 2 account for the year (New Zealand Tourism). In 2020, this dropped to 25% more article views in total. Especially towards the end of 2020, the Tourism Authority of Thailand’s three WeChat accounts all increased average views significantly, and sat at the top of the rankings charts week after week. This seems part of a major push to promote tourism to Thailand on the Special Tourism Visa and keep it top of mind as an international travel destination when Chinese outbound tourism returns at scale.
Click here to see the top 10 most-viewed WeChat posts by NTOs in 2020
Most of the top-ranking NTOs scaled back how much they posted in 2020, but there are a few notable exceptions – VisitBritain posted more than twice as many articles in 2020 as in 2019, and Turespaña increased by just over 50%.
Peru ranked 15th for total views in 2020, the first time a Latin American tourism board has ever appeared in the annual top 20 list. But unlike in years past, there were no African tourism boards on the top 20 list.
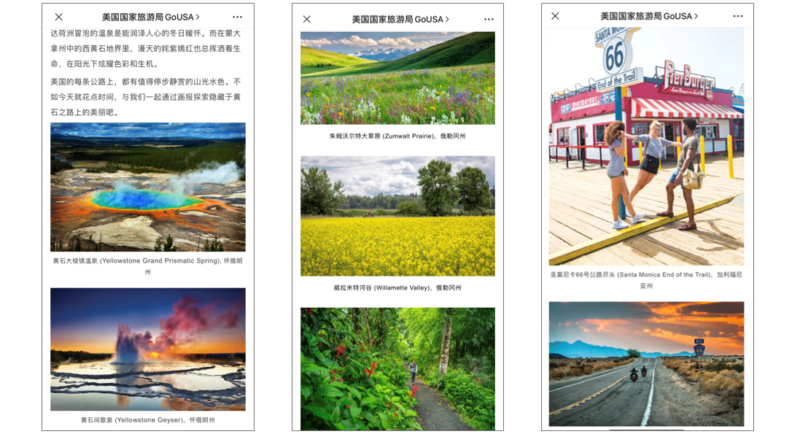
Brand USA’s content on nature and self-driving was popular with WeChat users in 2020
Despite volatile Sino-US relations and a travel ban on Chinese visitors, Brand USA actually moved up the rankings in 2020 from 14th to 10th place, and increased average views per post from 3,553 in 2019 to 5,206 in 2020 (+46.5%). Top content included several articles on self-driving in the US, an article on Yellowstone National Park, and others on romantic gardens, the Great Lakes, and flowers.
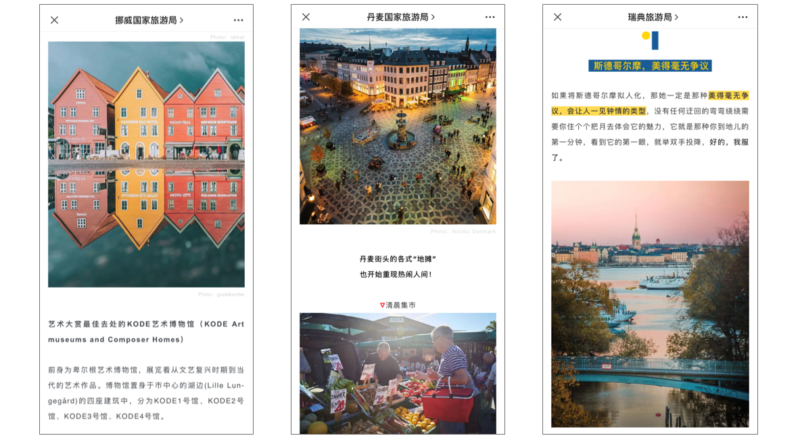
While nature-themed content always does well, articles on Scandinavian cities got some of the highest views for the Norwegian, Danish, and Swedish national tourism boards in 2020
On the whole, Scandinavia stands out as a really strong region for destination marketing on WeChat, with Sweden, Norway, Denmark, and Finland all featuring in the top 20 accounts for the year. None of the four accounts had major fluctuations in how much content they posted in 2020 compared to 2019, with average views just slightly higher or lower, depending on the account. Finland posted the most-read NTO article of the year – an informational article at the start of the coronavirus outbreak – and other top Scandinavian content featured nature, seasonal beauty, cities, Christmas, and an article on why Swedish children are so happy.
DMOs
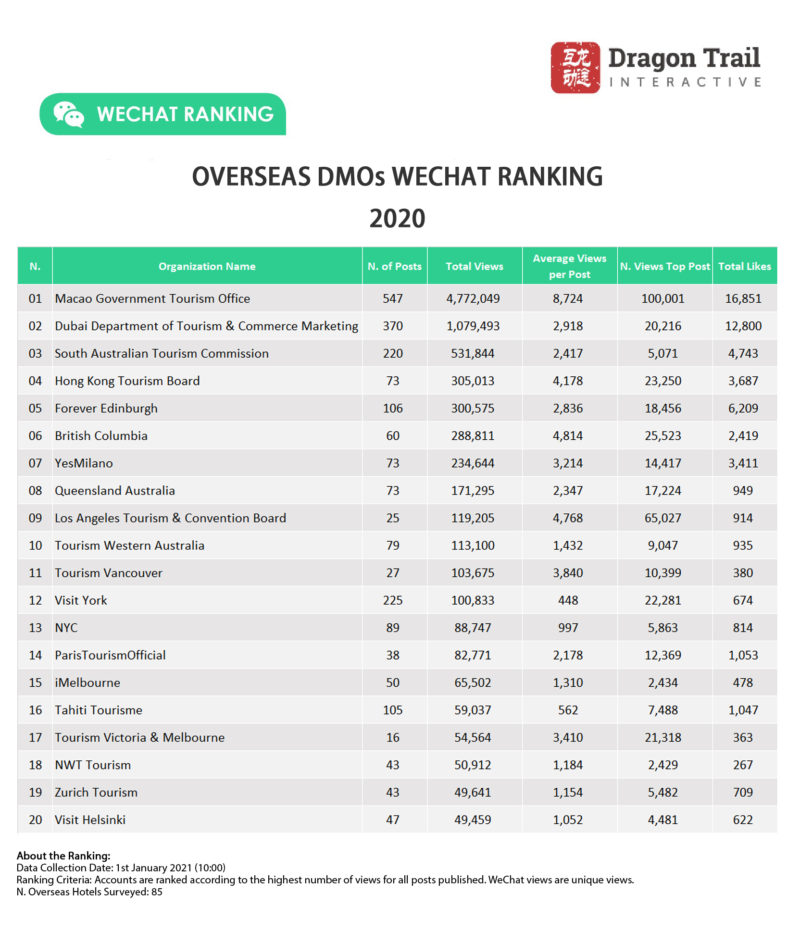
In the DMO category for regional and municipal tourism board this year, Macau is a true outlier.
– Macau captured more than double the total annual article views compared to any other tourism board (NTOs included) in any year we’ve tracked. The Japan National Tourism Office got 2.3 million article views in 2019, compared to Macau’s 4.77 million in 2020.
– Macau got more than four times more content views in Q4 2020 alone than it did in the whole of 2019.
– It accounted for 76.2% of all DMO content views in Q4 2020, getting more than 10 times more views than any other account.
– Looking at 2020 as a whole, Macau accounted for nearly half of all DMO content views, getting more than four times more views than the next biggest account by total views (Dubai).
– In 2020, Macau not only posted more content than any other DMO (547 posts vs. an average of 53), but it also got the highest average views per post. Macau’s average views per post increased from just 1,806 in 2019 to 8,724 in 2020.
What are the reasons behind this record-breaking performance? First, by the end of 2020, Macau was the only outbound destination in the entire world that mainland tourists could visit without facing quarantine on return – and one of the only world destinations that mainland tourists could visit, period. Second, the tourism board obviously invested very heavily into attracting back the mainland market, posting 28% more content, and certainly promoting at least some of this content through WeChat advertising to reach a wider audience.
Click here to see the most-viewed DMO posts of 2020
Compared to the year before, North American DMOs didn’t feature so prominently at the top of the rankings table in 2020, with accounts such as Vancouver, Orange County and Travel South dropping significantly in terms of total views. For these and other accounts, the key factor is that their content volume decreased dramatically – with no prospect of Chinese visitors in the near term, these three accounts all went from more than 100 posts in 2019 to less than 30 in 2020, while average views per post either held steady or even increased.
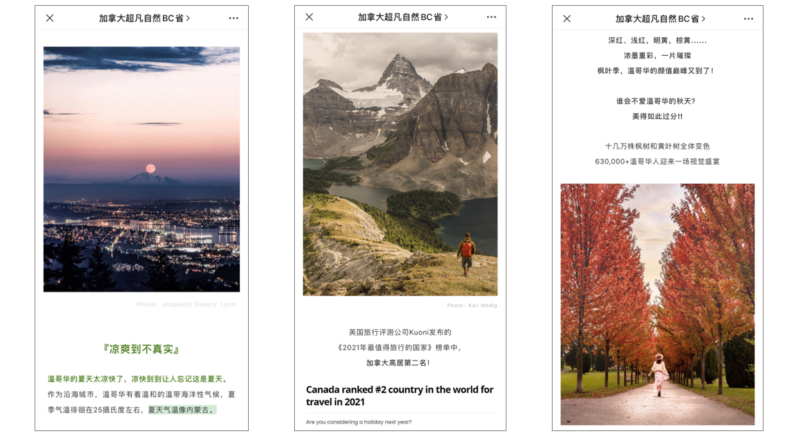 After Macau, British Columbia (pictured) was the DMO with the highest readership for 2020 WeChat posts
Apart from Macau, the two DMOs that stand out for successful performance on WeChat in 2020 are British Columbia and Edinburgh. British Columbia had the second highest average views per post for a DMO, rising from 9th place in 2019 to 6th in 2020 for total views, and increasing their average views per post by 41.2%. The province posted throughout the year about global rankings that named its cities Vancouver and Victoria as “most liveable,” and proclaimed Canada the no. 2 country for travel in 2021 – these were among the most-viewed articles.
Edinburgh posted just two additional articles in 2020 compared to 2019, and moved up the annual rankings from 10th place to 5th, with a 31.8% increase in average views per post. Content featuring UGC photos and the sentiment of missing the Scottish capital had the best performance.
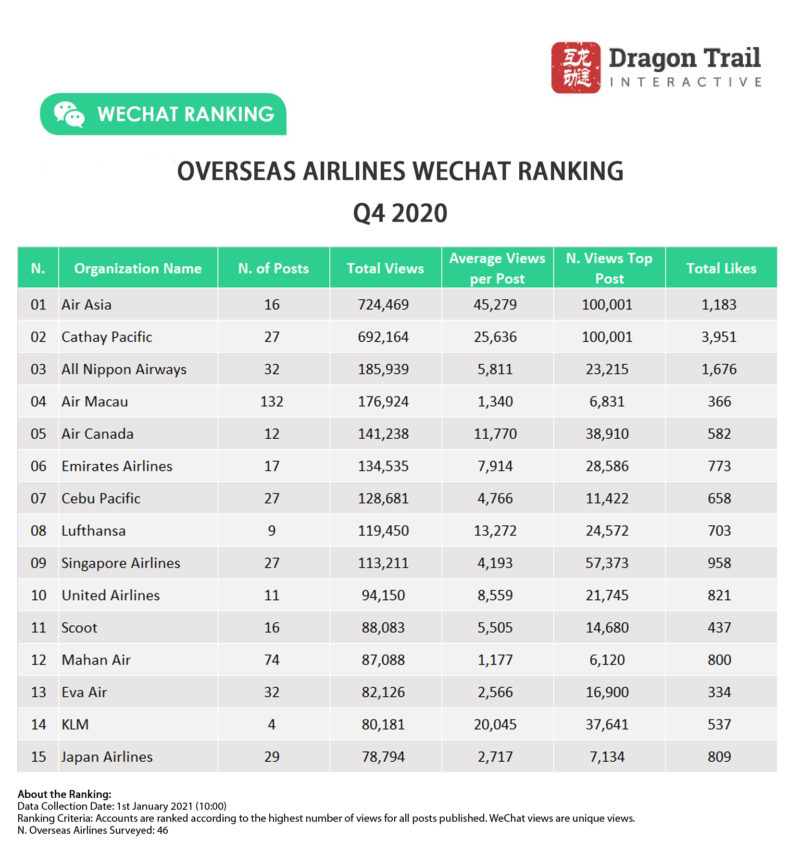
Airlines

The list of top airline accounts by views on WeChat has not changed dramatically during 2020, but the category did see a sharp decline in active accounts – from 44 in Q1 to just 33 in Q4 – as well as a very significant change in content compared to 2019. Average views per post soared at the start of the coronavirus crisis, with a 31.1% year-on-year increase in views per post. However, this drops to just a 2.76% increase in average views per post in Q4 compared to the same period a year earlier.
In general, long-haul carriers like Cathay Pacific, Air Canada, KLM, Emirates Airline, Air France, and Lufthansa all saw dramatically increased average views per post in 2020 compared to 2019, with short-haul carriers getting similar or fewer average views. In 2020, airlines used their WeChat accounts to communicate essential information about safety policies and testing, cancelled flights, and resumed routes, and these are the kinds of articles that generally got the most attention – for example, Cathay Pacific’s article on the closure of Cathay Dragon, with more than 100k views, or Delta’s June announcement of resumed US-China services, with 99,628 views.

AirAsia barely paused its promotions in 2020, pivoting to Chinese domestic tourism for a strong end to the year
One airline that stands out as doing something different is AirAsia, which kept on rolling out promotions all year long, shifting from low-cost flights to Southeast Asia, to domestic Chinese routes. In past years, AirAsia has always topped the WeChat Rankings, and 2020 was no different.
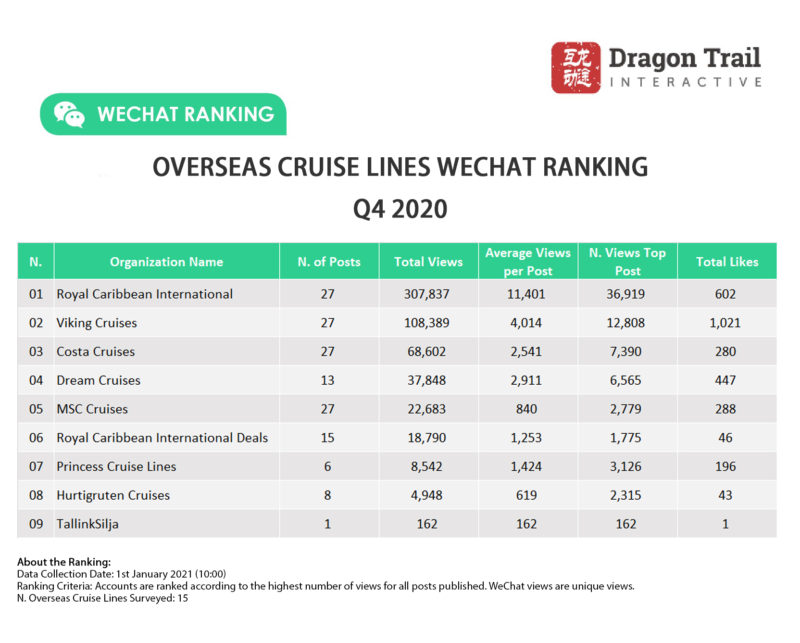
Cruise Lines
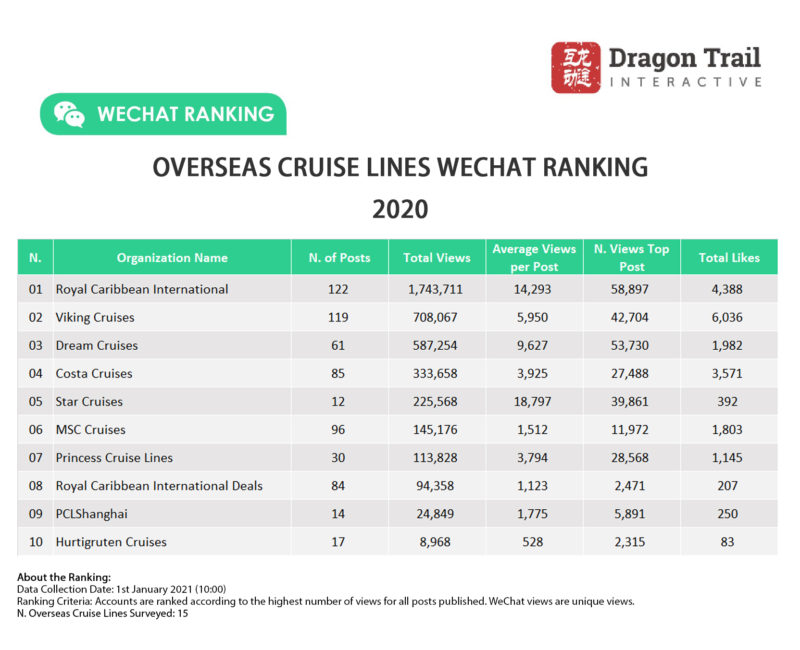
2020 was an undeniably terrible year for the cruise industry, and performance on WeChat only confirms this, with less than half the number of posts as in 2019, and a 33% drop in average views per post for the full year – and a 62% year-on-year decrease in average views per post in the last quarter.

Articles addressing the growing coronavirus crisis in the winter of 2020 outperformed any later promotions for cruise lines on WeChat
All accounts significantly decreased their volume of content, and the top articles were either pre-pandemic promotions, or crisis-related: Royal Caribbean International’s posts on mask donations and the safe return of one ship’s Chinese crew; news updates on the Diamond Princess; and Viking Cruises’ and Costa Cruises’ safety protocols.
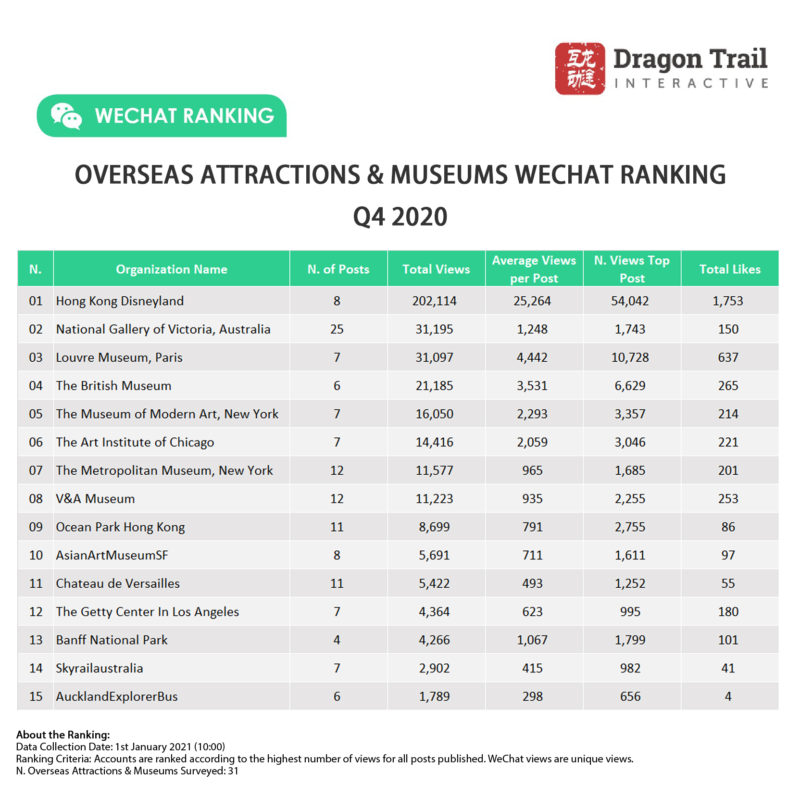
Museums and Attractions
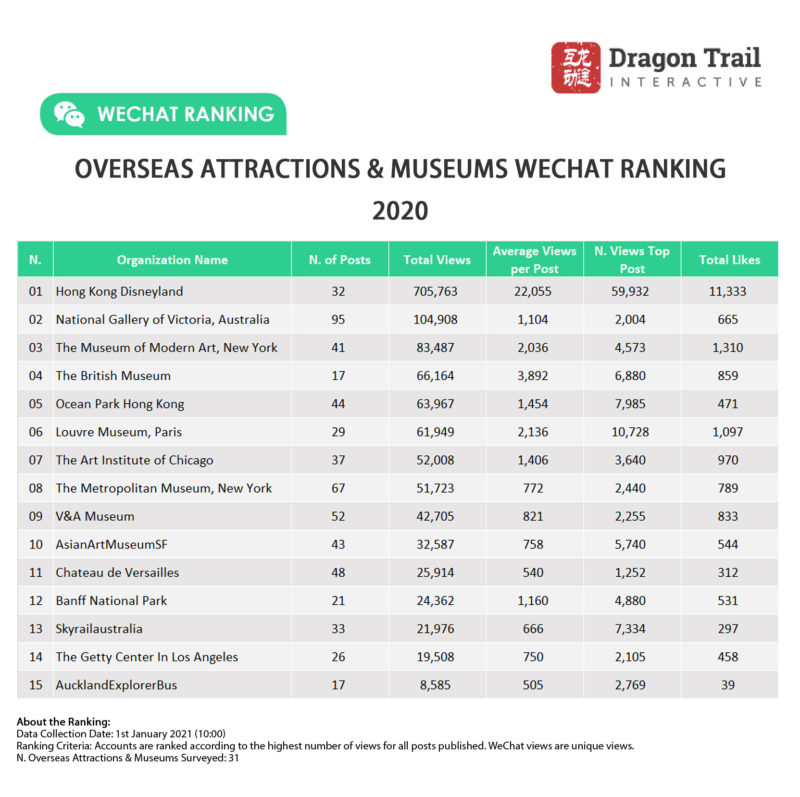
Comparing Q4 2020 with Q4 2019, the number of active museum and attraction accounts dropped from 23 to 20, and content dropped by a third, from 252 posts to 168. However, comparing the two periods, average views per post actually increased by 70.6%. Looking at the year as a whole, content decreased by 16% compared to 2019, and views per post rose by 8.9%. Especially given the lack of international travel, it made sense for museums and attractions to cut back on their frequency of posting, and get bigger results when they did release fresh content.
Click here to see the top 10 WeChat article posted by museums in 2020

The National Gallery of Victoria in Melbourne increased the number of WeChat articles published in 2020 and rose up the rankings from 2019
This was not the strategy followed by the National Gallery of Victoria, however, which was the only institution to significantly rise in the WeChat rankings by total views, from 6th place in 2019 to 2nd in 2020. The Australian museum remained in 8th place for average views per post, but nearly doubled its content volume, despite being closed for Melbourne’s 112-day lockdown.
Outside of museums, Hong Kong Disneyland easily stayed at the top of the rankings, though many of its top posts throughout the year were about closings (January, July, and December) and re-openings (June and September). Ocean Park Hong Kong’s top posts also included re-opening and closing announcements, while Skyrail Australia attracted attention with a January post about bushfires, and Banff National Park’s 31 January letter to Chinese visitors was also popular. As in the case of airlines, 2020’s most-viewed content for attractions centered much more on practical information and crisis communications than on promotions.
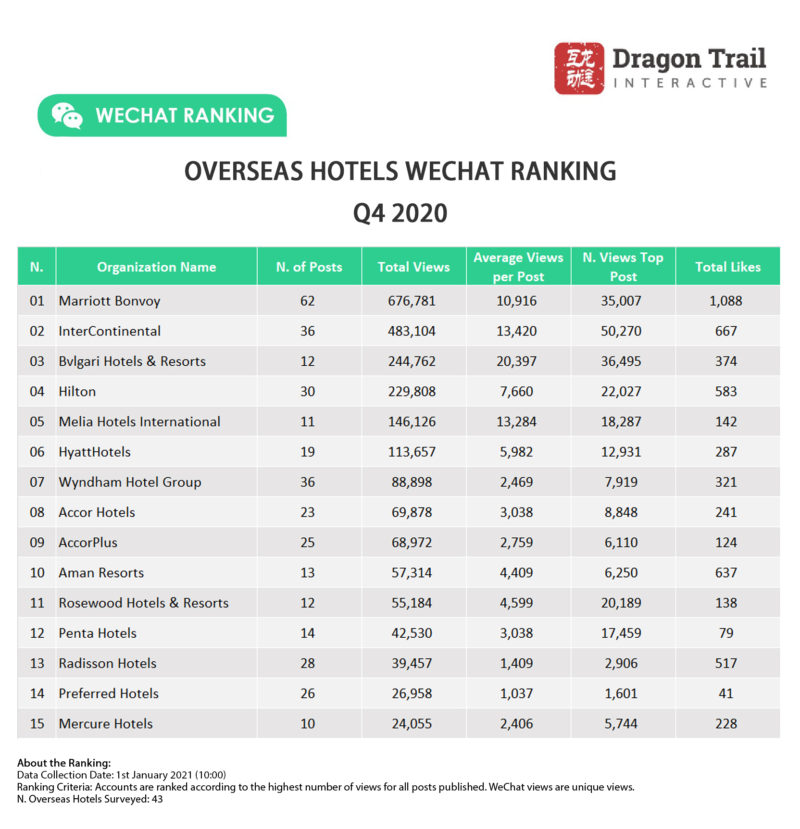
Hotels
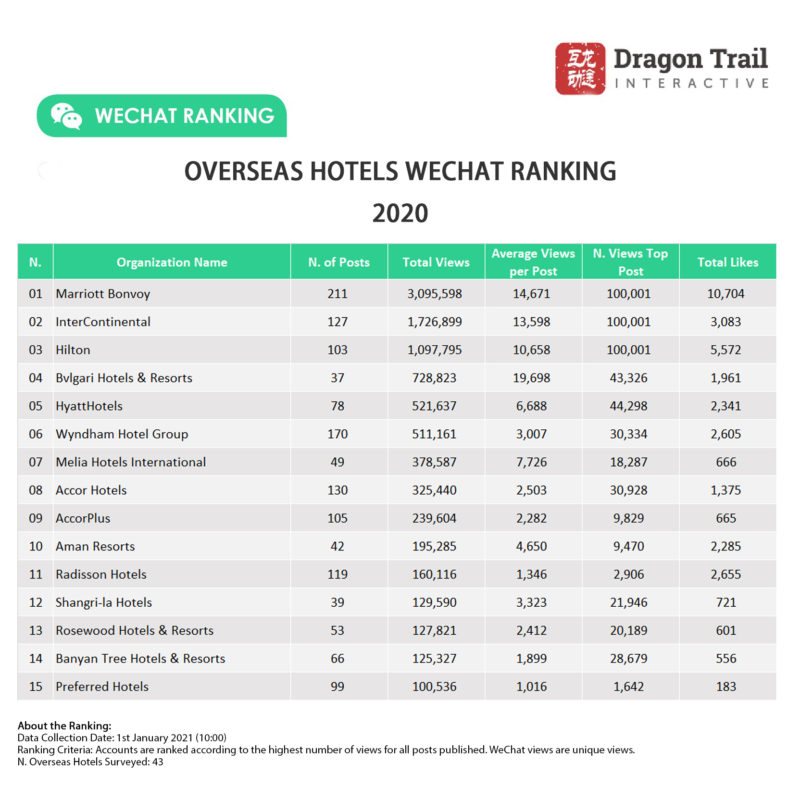
The hotels category provides a major contrast to others in our WeChat Rankings in that many of the accounts are international chains that could actually attract Chinese tourists in 2020 – to their mainland Chinese properties. The recovery of the domestic tourism market in 2020 was very healthy, and it’s also quite possible that major brands put extra effort into promotion for mainland China as one of the only markets where they could hope to hit profitable occupancy rates.
In the hotels category, the average views per post increased by 54.3% year on year for the full year, and 70% year-over-year for Q4 – which is also a testament to China’s domestic recovery. While hotels with no properties in China, such as Singapore’s Marina Bay Sands, decreased their content, chains with a presence in China increased both their amount of content and content views. For example, InterContinental Hotels Group posted more than three and a half times more content in 2019 compared to 2020, and average views soared by 242%.

Hotel promotions helped to drive China’s domestic tourism recovery, as well as WeChat article views
In 2019, no hotel account broke the 100k views threshold for a WeChat article – in 2020, Marriott, InterContinental, and Hilton all did. For Hilton and Marriott, these were posts during China’s lockdown period, on cancellation policies and the extension of members’ benefits. For IHG, it was an April promotion to stay one night and get the second free. For the most part, starting in the spring, all of the most-read hotel articles of the year were domestic promotions like this one – Marriott announced “Spring is finally here” in April, lighting up the front of properties around the country with smiley faces and offering rooms from RMB1. In June, InterContinental partnered with Eastern Airlines on their all-you-can-fly deal. In August, Hilton promoted family travel with free gifts for kids. These popular and generous hotel promotions must be seen as one of the driving forces behind the recovery of domestic tourism, alongside creative sales and deals by airlines, OTAs, and other Chinese tourism businesses.
Rankings tables for Q4 2020

The wonderful partners we work with


Sign up for our free newsletter to keep up to date on our latest news
We do not share your details with any third parties. View our privacy policy.
This website or its third party tools use cookies, which are necessary to its functioning and required to achieve the purposes illustrated in the cookie policy. If you want to know more or withdraw your consent to all or some of the cookies, please refer to the cookie policy. By closing this banner, scrolling this page, clicking a link or continuing to browse otherwise, you agree to the use of cookies.