


Dragon Trail International’s Weibo Rankings Report tracks and analyzes performance for national tourism organizations (NTOs), destination marketing organizations (DMOs), airlines, cruise lines, museums & attractions, and hotels. Like the weekly rankings reports, the quarterly report builds industry benchmarks and uncovers best practices in digital marketing in the travel sector.
Although most tourism categories did not see significant growth in engagement in Q3 2021, follower numbers continued to grow, with the exception of the cruise category.
Hotels and DMOs were the only two categories driving engagement growth. We continue to notice celebrity-endorsements and giveaways generating high engagement in Q3, and this type of content drove engagement for hotels and DMOs. However, such growth is short-lived – we can see that the increase of engagements for NTOs driven by celebrity-endorsed content in Q2 2021 did not carry on to the next quarter.
Many accounts in Q3 have leveraged a mix of videos and storytelling to drive engagement levels. Some of this content actually drove higher engagements than celebrity-driven posts.
Methodology
Engagement rate is engagement divided by follower base. Starting from the Q1 2021 report, we have adjusted engagement rate to account only for weeks when posts were published, to better reflect accounts with top performing posts. This method is applied to historic data when comparing between time periods.
Account data from 176 active tourism accounts on Weibo was collected and exported at the end of each week. The Q3 report is based on data collected between 4 July and 3 October, 2021.
2021 Q3 Weibo Engagement Rate by Category
The figure below shows engagement rate for each account category in Q3 2021.
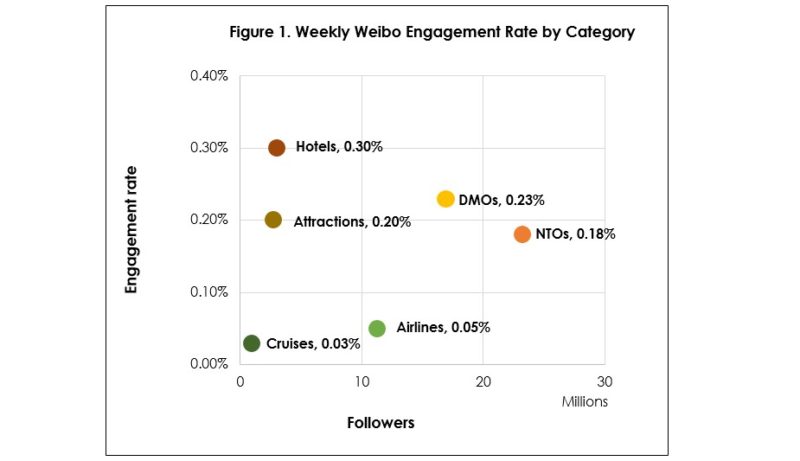
– Engagement rates for attractions and museums and for hotels are high. The engagement rate for the hotel category increased significantly from 0.09% in Q2.
– Engagement rates for DMOs and NTOs are also high, but NTOs dropped from 0.35% in Q2 while DMOs remained relatively the same.
– Airlines and cruise lines both have lower engagement rates, which remained relatively stable from Q2.
NTOs
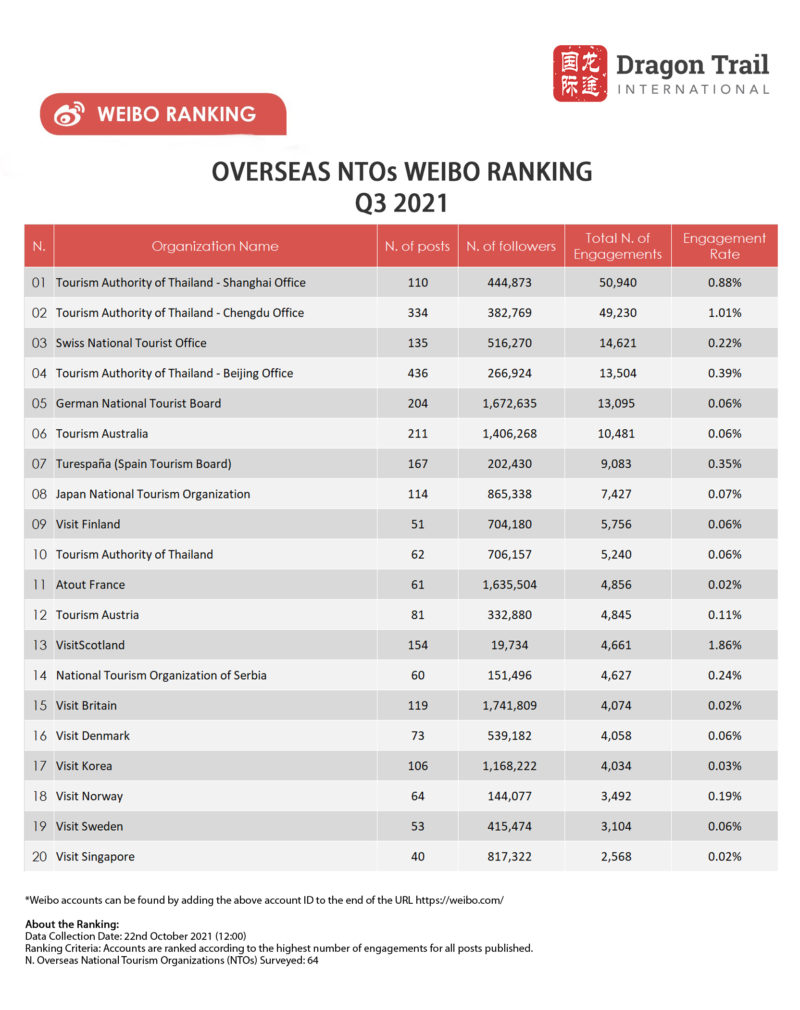 Fifty-one accounts were active in Q3 2021, just one fewer than in the previous quarter. NTOs saw a decrease in engagement rate from Q2, which was heavy on celebrity-driven content.
Looking into content in Q3, the Tourism Authority of Thailand’s accounts continue to generate strong engagement. With the re-opening of Samui and Phuket, top content included re-opening news, outdoor activities, and beach scenery.
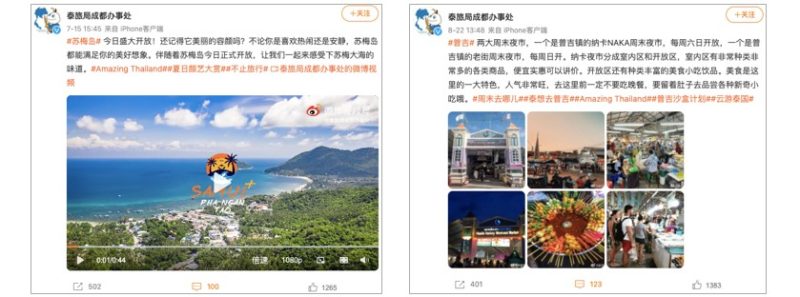 Tourism Authority of Thailand – Chengdu Weibo posts on the opening of Samui (left); and weekend night markets in Phuket (right)
Hotels
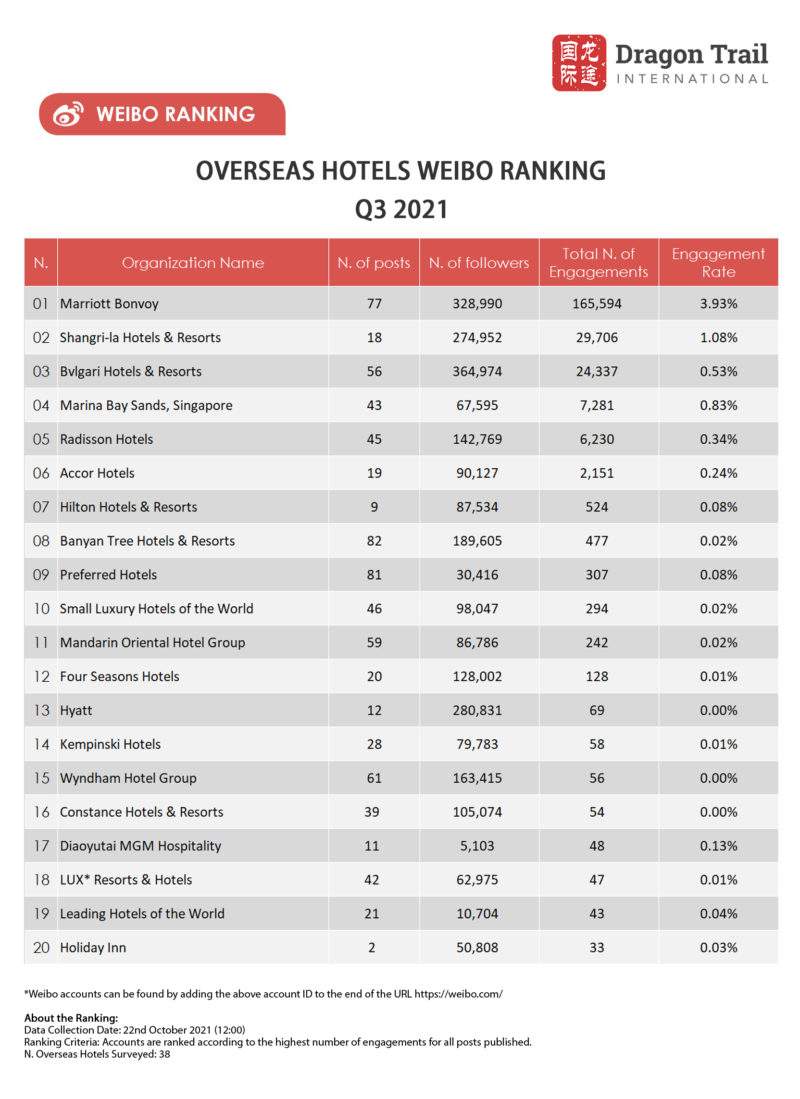 Twenty-five accounts were active in Q3, the same as in Q2. The hotel category saw a significant increase in engagement driven by celebrity-endorsed content. The majority of engagement growth was driven by MarriottBonvoy’s #旅行让我们 (“travel allows us to”) campaign, promoted with film producer Mani Fok.
Besides celebrity endorsements, Shangri-la Hotels & Resorts’ 3rd episode of their short video mini series 香亲相爱 (“Love each other”) also drove up engagements. This mini series has generated higher engagements than some of the celebrity-endorsed posts. Its content explores Chinese family dynamics and common struggles, such as the busy schedule of raising school age children, and the big role grandparents play in bringing up their grandchildren.

Left: Marriott Bonvoy’s videos featuring Mani Fok; Right: Shangri-la Hotels & Resorts’ short video on grandparents taking a break from looking after grandchildren to enjoy their retirement
Attractions & Museums
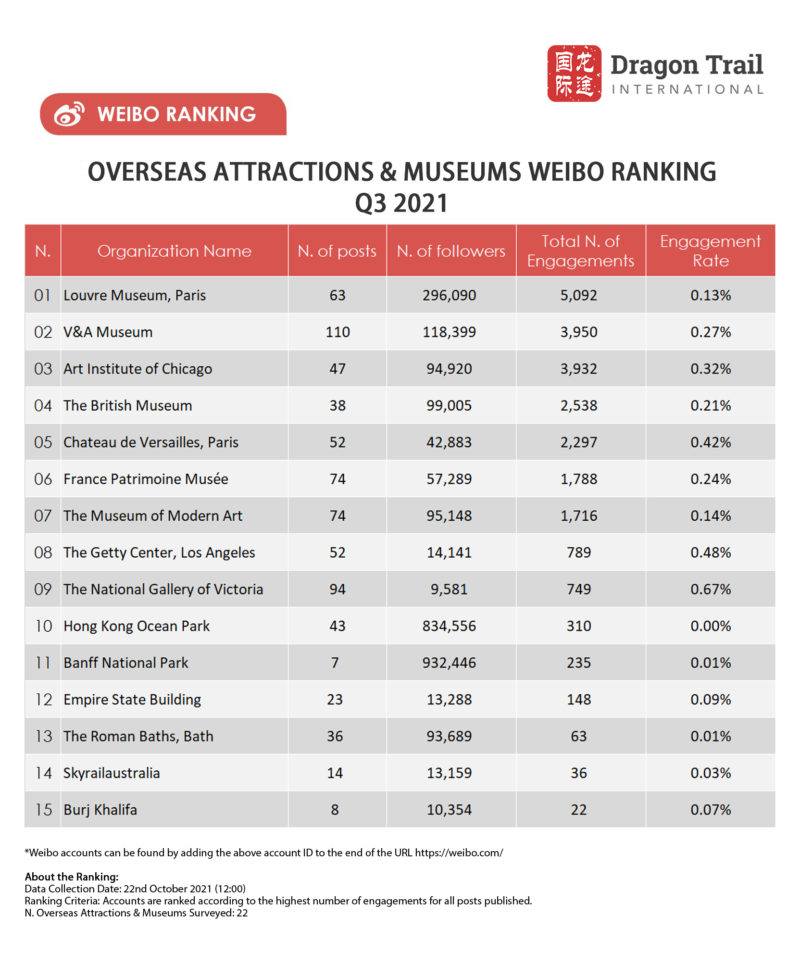 Sixteen accounts were active in Q3, the same as in Q2. The engagement rate also remained the same as the previous quarter, at 0.20%. Looking at top content, engagement was driven by a mix of videos and storytelling to illustrate art collections and the creative process.
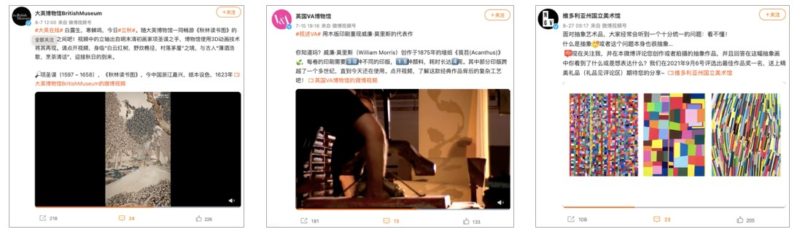 Left: The British Museum’s 3D animation of a Chinese painting; Middle: V&A Museum on block printing with William Morris’ design; Right: The National Gallery of Victoria on interpreting abstract art.
DMOs
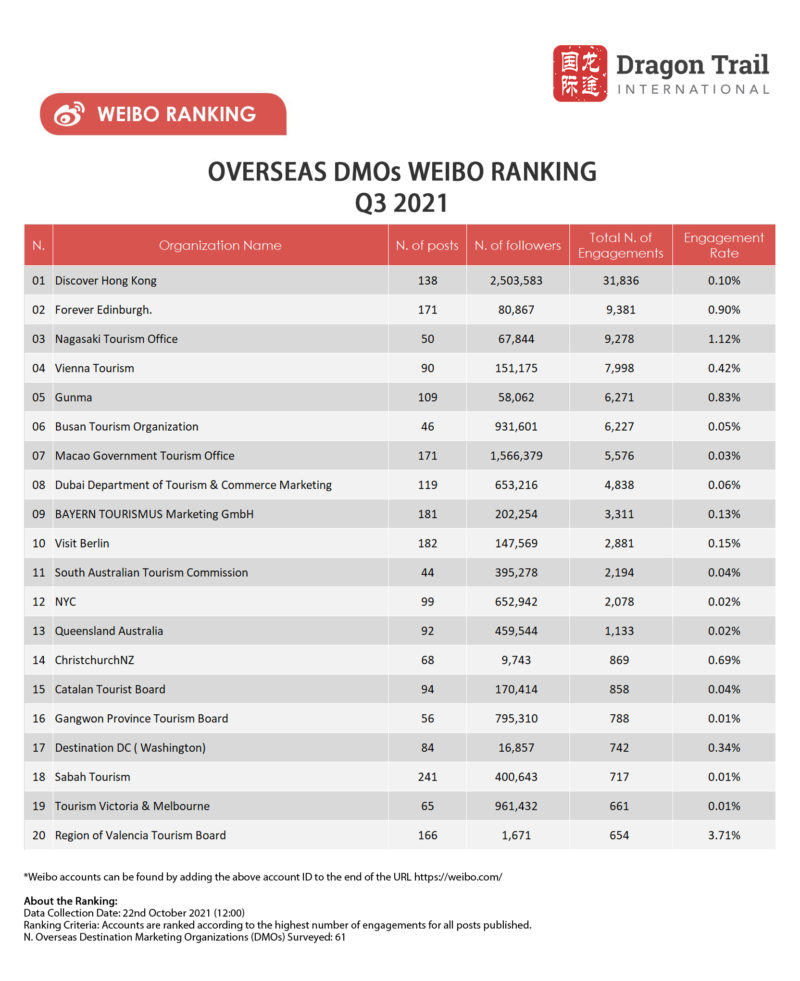 Forty-one DMO accounts were active in Q3, down by one account compared to Q2. The engagement rate remained relatively the same compared to Q2. Accounts with positive engagement levels leveraged giveaways, shared destination knowledge, and used celebrity-related content.
Airlines
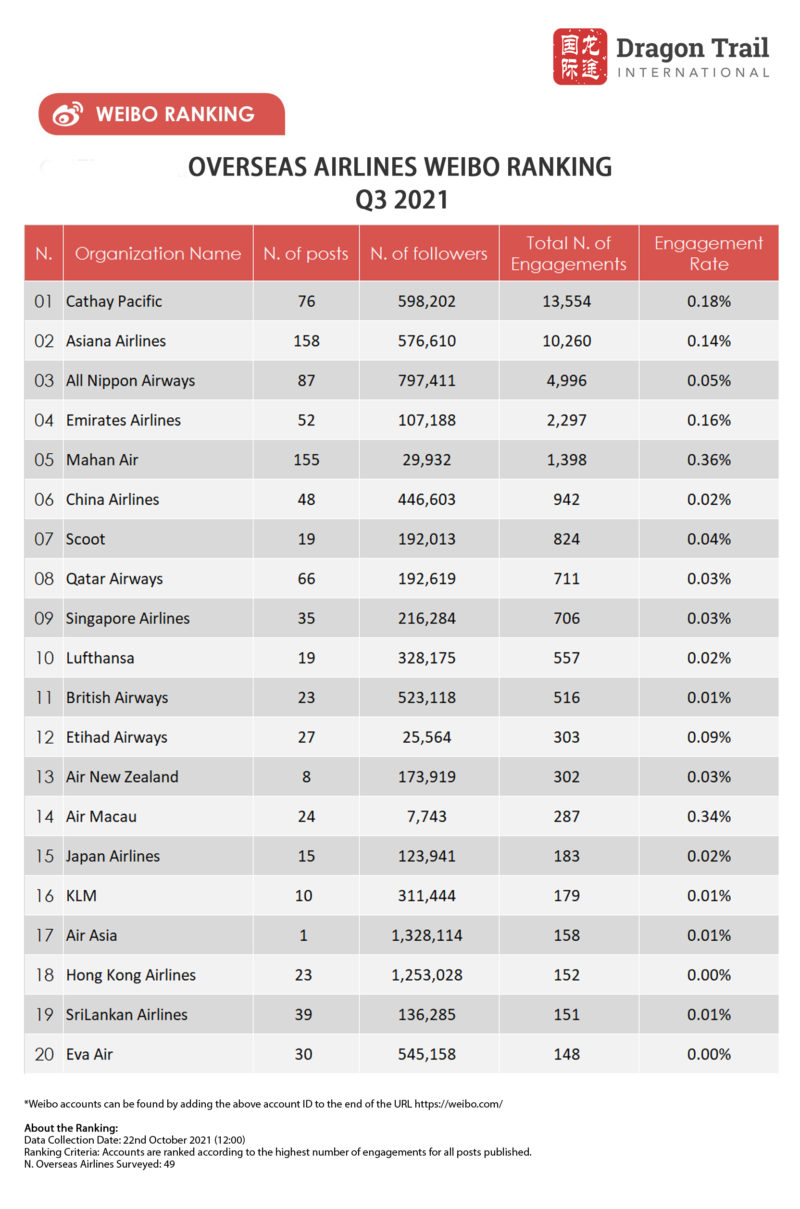 Thirty-six airline accounts were active in Q3, up by three compared to Q2. The engagement rate was similar to the previous quarter. Q3 saw growing engagement around flight resumption news and giveaways. Comments reflected strong demand for flight booking, as well as concerns around pricing.
Cruise Lines
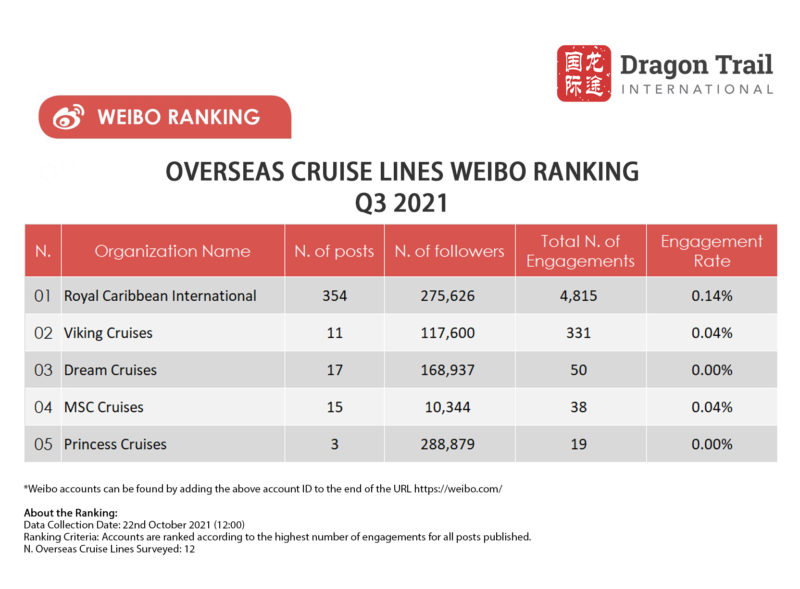 Seven cruise accounts were active in Q3, the same as in Q2. The cruise category has seen a decline in both followers and engagement levels over the past quarter. The posts with the most engagement were giveaways during the Mid-Autumn Festival, which led to growth in engagement rate for Viking Cruises.
The wonderful partners we work with


Sign up for our free newsletter to keep up to date on our latest news
We do not share your details with any third parties. View our privacy policy.
This website or its third party tools use cookies, which are necessary to its functioning and required to achieve the purposes illustrated in the cookie policy. If you want to know more or withdraw your consent to all or some of the cookies, please refer to the cookie policy. By closing this banner, scrolling this page, clicking a link or continuing to browse otherwise, you agree to the use of cookies.