


In order to objectively understand and analyze the travel industry’s use of China’s most popular social media platform, WeChat, Dragon Trail Interactive has tracked and compiled weekly data on WeChat activity by overseas tourism boards, airlines and cruise lines since the start of 2017. This information allows us for the first time to understand what kinds of strategies and content resonates best with WeChat’s 938 million monthly users. Following on our Q1 analysis of the most successful themes for travel industry WeChat posts, and the top performing posts of Q2, this report looks at the overall rankings as they stand at the end of Q3 and how they have changed throughout the year, with applicable insights and advice for travel brands on WeChat.
National Tourism Organizations
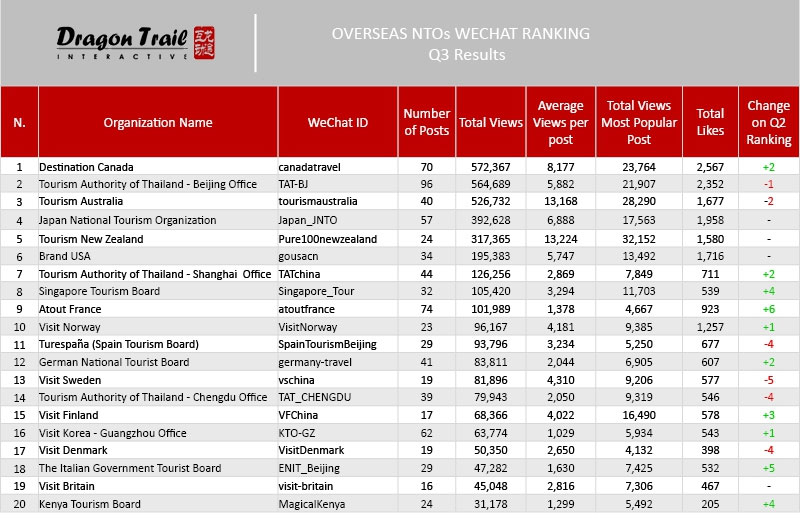
First place for NTOs this quarter is Destination Canada, which has been in the top 3 all year but hadn’t reached the no. 1 spot before. Maintaining its position in 2nd place is the Tourism Authority of Thailand – Beijing Office, and dropping from 1st to 3rd this quarter is Tourism Australia.
In terms of posting frequency, the Tourism Authority of Thailand – Beijing Office, has posted more regularly than any other NTO throughout the year, with 96 posts in Q3, up from 88 in Q2. Destination Canada also increased their number of posts in Q3, from 59 to 70, and Tourism Australia increased from 36 to 40.
Destination Canada picked up on the self-driving trend in Chinese tourism this quarter, posting popular articles on self-driving and traveling by RV in Canada, in addition to several posts on autumn foliage, and tips on what to eat in Canada. Thailand has reacted to the fact that 60% of its Chinese visitors are female (even more than the 56% of Chinese outbound travelers who are) by posting articles throughout the quarter that were aimed at women, including recommended activities for female travelers, an article on women’s journeys through Thailand, and information on the Women’s Run. Australia had some hits with user-generated content, including articles on followers’ replies to a question on luxury vs. budget travel, and followers’ comments about Australia. And in addition to Australia’s usual posts about nature – with top articles on the aurora borealis and wombats – they also changed things up this quarter with two posts on shopping, as well as a deal on Cathay Pacific flights, tips on accommodation and several event-related posts.
Australia still comes out on top for the average number of post views, with an average of over 13,000 views per post for the quarter. The only other NTO breaking the 10,000 view mark is New Zealand, which posted only 24 times during the quarter, and ranked 5th overall. Destination Canada has consistently received an average of around 8,000 average views per post throughout the year.
The most-viewed post of the quarter was Destination Canada, which received 23,764 views for its early September post on seeing maple trees in Canada. However, this was only half of the 46,029 views that Canada’s top post of Q2 received, which was about Canada’s 150th anniversary celebrations.

Destination Marketing Organizations
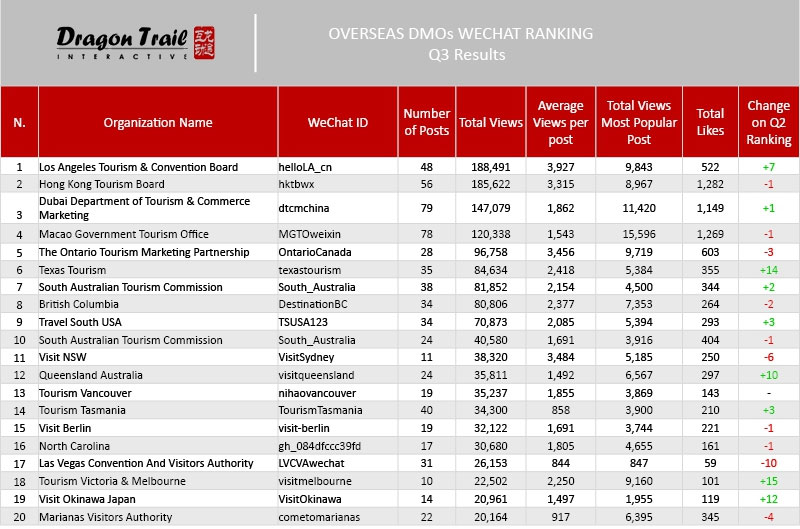
The big winner for DMOs this quarter is the Los Angeles Tourism & Convention Board. After being in 5th place after Q1 and 8th place after Q2, they rose to 1st place in Q3. Usually in 1st place, the Hong Kong Tourism Board was in 2nd this quarter. Dubai crept back into 3rd place as Macao dropped down to 4th.
Los Angeles went from a total of 95,513 page views in Q1, to 77,358 in Q2, to nearly 200,000 in Q3. They also increased average views from 1,592 in Q1 and 1,646 in Q2, to 3,906 in Q3. LA’s top post for Q3, which was about ‘One day in LA – must-see activities’ got 9,843 views, in comparison to 5,462 views for its top post of Q2.
Other popular articles by the Los Angeles Tourism & Convention Board include whale watching in LA, ‘How do US families like to travel?’, a guide to celebrity-spotting, free museum days, where to watch the sunset in LA, and the city’s best Chinese restaurants.
Looking at DMOs as a whole, there is huge variation in the total views, with Los Angeles and Hong Kong close to 200,000, and the average total views less than 50,000. In terms of average views per post, Visit NSW was actually in second place in Q3, with about 3,500 views per post. The top posts of the quarter were Macao’s post on the cancellation of the 29th Macao International Fireworks Display Contest due to a typhoon (15,596 views), Gold Coast Tourism’s post on Chinese supermodel Xiaowen Ju’s trip to the Gold Coast (9,899 views) and Los Angeles’ top post on ‘One day in LA’.

Airlines
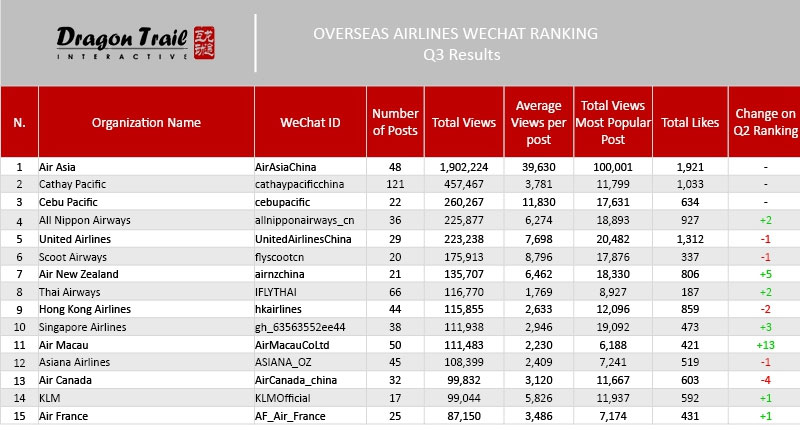
There was no movement in airline account rankings in Q3 from the first half of the year, with Air Asia, Cathay Pacific and Cebu Pacific in 1st, 2nd and 3rd, respectively.
Air Asia’s total post views numbered over 2 million in Q3, far ahead of second place Cathay Pacific, which got a total of 457,467 views. Cebu trailed at around 260,000 views, followed by All Nippon Airways at around 226,000 and United Airlines with around 223,000. Air Asia also again published the highest viewed post, with over 100,000 views, followed by United Airlines with 20,000 views for its highest performing post, Singapore Airlines with 19,000 and All Nippon Airways at 18,800.
At the start of the year, the content in this category was all based around sales and deals, but we saw more varied topics in Q2, and this has continued into Q3. Air Asia especially published non-sales related stories, such as their ‘Top 10 adventure destinations’, guide to niche island destinations, and Malaysia travel diary. United Airlines also did well with its guide to San Francisco and post on American specialty foods.
Cruise Lines
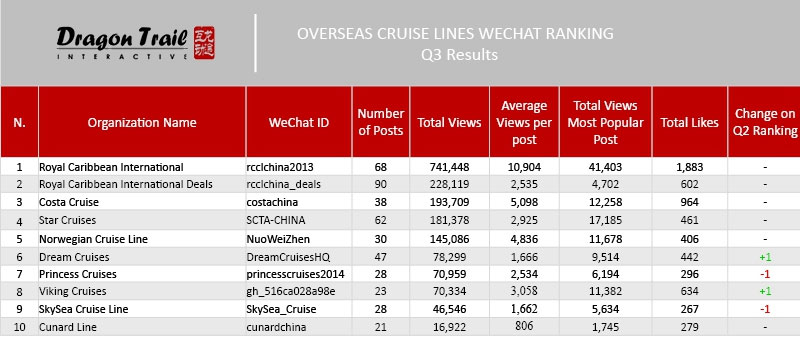
Cruise line rankings were also consistent from Q2, with Royal Caribbean Cruises and Royal Caribbean Deals in the top two spots, followed by Costa Cruises. Royal Caribbean’s Deals account posts the most out of any cruise line, with 90 posts for the quarter, followed by Royal Caribbean Cruise’s 68.
While the two Royal Caribbean accounts are still far ahead in terms of total views, the average views for both accounts have been dropping throughout the year, from about 16,000 in Q1 to 10,904 in Q3 for Royal Caribbean Cruises, and from 5,134 to 2,535 average views for their Deals account. At the same time, Costa Cruises grown steadily from about 3,400 average views in Q1 to just over 5,000 average views per post in Q3. There has been quite a lot of movement in the average views for posts from other cruise lines as well: Dream Cruises dropped from an average of nearly 3,000 views in Q1 to about half that in Q2 but has stabilized in Q3. Princess Cruises also got only half the average views in Q2 as it did in Q1, and dropped even further in Q3. Meanwhile, Star Cruises’ average page views have slowly but steadily risen, similar to Costa Cruises, and Viking Cruises’ average views have soared from just 489 in Q1 to 3,058 in Q3, though they have only moved up the overall rankings one place.
These fluctuations show that the cruise line field is more competitive and active that the unchanging top 3 rankings reveal, and this reflects how the cruise industry is heating up and becoming more competitive in China.
Like airlines, cruise lines have also diversified content away from just writing about sales promotions, and some of the top articles from Q3 included information on activities, parties, shopping and food aboard cruises, location guides, and practical tips for cruising and boarding.
A note about account categories
There are two different ways that organizations and companies can run their WeChat accounts: One is a subscription account, which allows for daily posts. The other is a service account, which has more functions for users, but only allows a maximum of four content posts every month – companies with service accounts tend to publish a weekly newsletter with four or five different articles. Airlines and cruise lines are more likely to have service accounts, as they are more sales-driven, while National Tourism Organizations (NTOs) and Destination Marketing Organizations (DMOs) all focus on content through subscription accounts. Airlines receive the most traffic, on average, followed by cruise lines, NTOs and then DMOs.
The wonderful partners we work with


Sign up for our free newsletter to keep up to date on our latest news
We do not share your details with any third parties. View our privacy policy.
This website or its third party tools use cookies, which are necessary to its functioning and required to achieve the purposes illustrated in the cookie policy. If you want to know more or withdraw your consent to all or some of the cookies, please refer to the cookie policy. By closing this banner, scrolling this page, clicking a link or continuing to browse otherwise, you agree to the use of cookies.