


Executive Summary
Dragon Trail’s 2019 Q4 and full-year WeChat Rankings Report examines and analyzes the performance of six categories of travel brands on WeChat: national tourism organizations (NTOs), destination marketing organizations (DMOs, referring to regional and municipal tourism boards), airlines, cruise lines, museums and attractions, and hotels. The results for the year reflect some trends in Chinese outbound tourism, such as a sharp drop for the Hong Kong Tourism Board account, challenges for North American NTOs, and sustained and escalating success for the Japan National Tourism Organization. Cruise lines especially made significant gains in readership rates this year, and impressive increases in reading rates for museums around the world reflects the growth of cultural tourism. In 2019, WeChat accounts engaged readers with more interactive posts, showing how this medium for B2C marketing is evolving to stay competitive and generate greater interest from WeChat users.
Introduction
For three years, Dragon Trail Interactive has tracked official accounts on WeChat for international travel brands, with weekly rankings that look at accounts based on how many total views they got for their articles published that week, as well as the total number of articles, most-viewed articles, and ‘likes’ on articles. We now have two years of data on national tourism boards (NTOs), destination marketing organizations (DMOs) for regions and municipalities, airlines, and cruise lines. From the end of March 2018, we have also tracked two additional categories: museums and attractions, and hotels.
This data reveals which accounts and types of posts are performing most successfully on WeChat, helping to provide an industry benchmark, and guide marketing decisions around WeChat strategies, as well as to reveal consumer preferences of Chinese outbound tourists. Our 2019 report examines how travel brands’ official accounts are performing overall, as well as within each category, and some of the biggest developments and trends from the past year.
Please scroll to the end of the report for Q4-specific data.
Reading Rates
In the first half of 2018, we saw average reading rates for NTOs, airlines, and cruise lines all fall compared to the year before, leading us to ask questions about the saturation of WeChat as a platform and if it was declining as a source of travel information. By the end of 2018, the picture was a bit more optimistic, with year-on-year gains in average readership for every category except for NTOs.
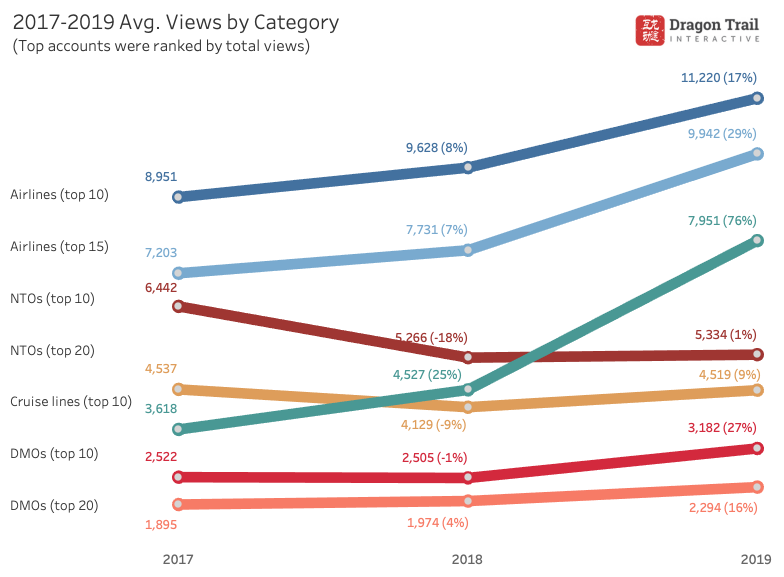
Comparing 2018 to 2019, there is modest growth for destinations, and much more significant growth in average reading rates for airlines and cruise lines. Cruise lines especially have nearly doubled their average readership in 2019 compared to 2017. The average reading rates for the top 10 and top 20 NTOs over the past three years have not been as positive, with major declines in 2018 because of a few key accounts. NTO reading rates recovered somewhat in 2019, but have still not returned to their 2017 levels. DMOs, on the other hand, have seen healthy gains in 2019 – it’s possible that Chinese travelers are now paying closer attention to more regional information regarding travel, especially for large countries like the US and Canada.
We have only tracked museum and attraction accounts since April 2018, so don’t have a full three years’ worth of data, but we have noticed significant gains in museum account views in 2019. Please see the museums and attractions section below for details.
What these reading rates tell us is that WeChat is still a very relevant platform for Chinese to read travel-related content, and that they are continuing to engage with this brand content – especially in the context of airline and cruise line accounts.
NTOs
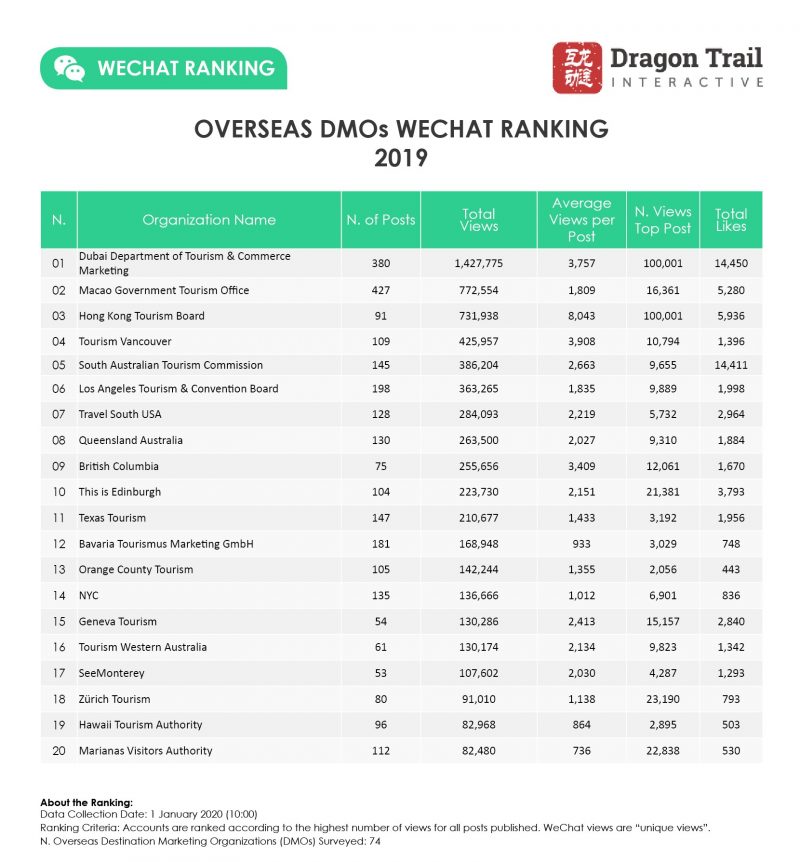
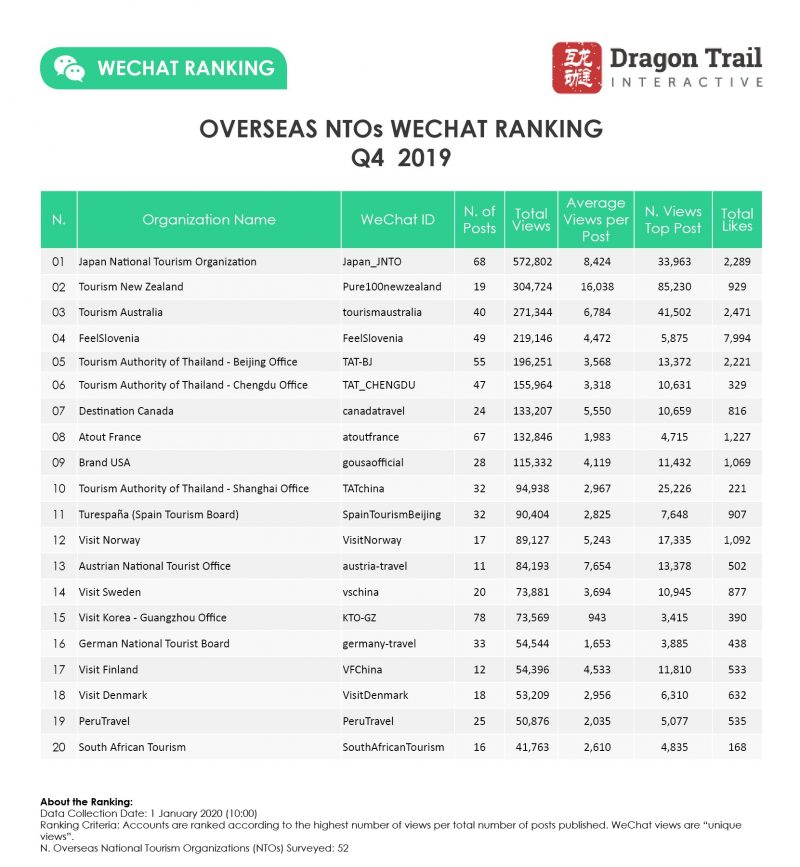
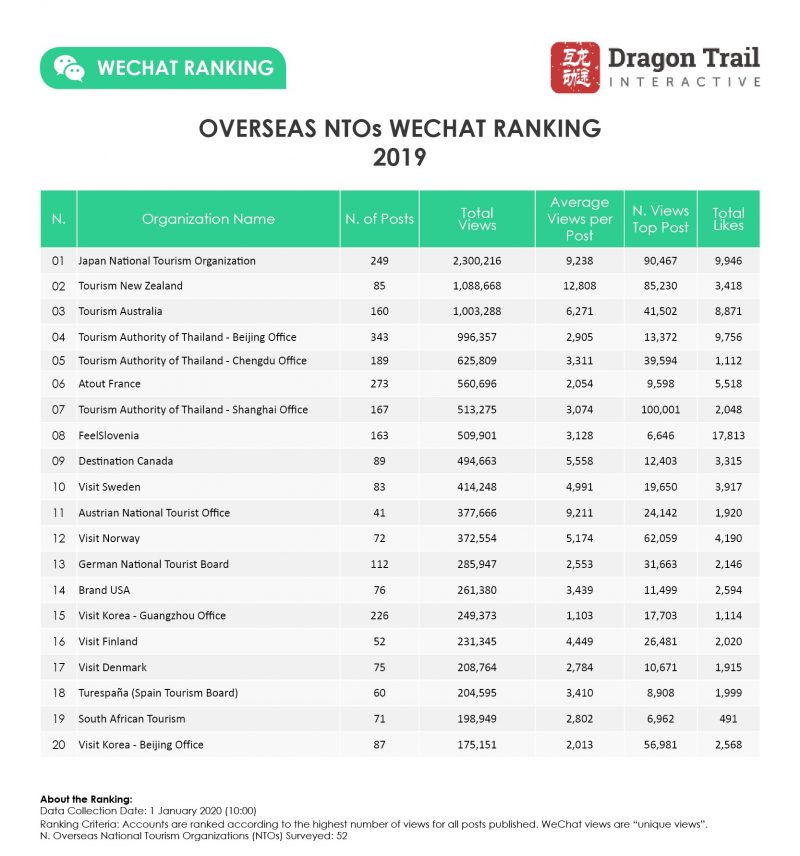 Japan maintained its strong lead all year, with more than double the article views of New Zealand in second place. Japan posted 23% more in 2019, and increased average article views by 4.4%. The success on WeChat corresponds with Japan becoming the most popular country for Chinese outbound tourists in 2019.
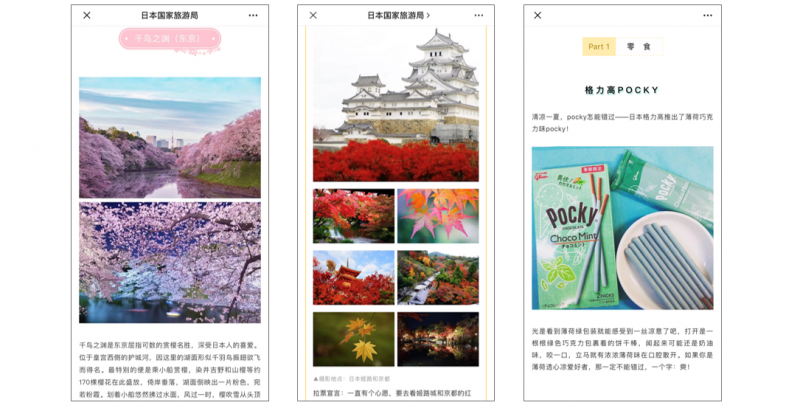 Seasonal beauty, area guides, and quirky posts on things like snacks, are all part of Japan’s winning WeChat content strategy
As in 2018, New Zealand ranked second, with the highest average views per post. Australia increased their WeChat content by 19.4% in 2019, and rose from 5th in last year’s rankings to 3rd.
Thailand takes a different approach to WeChat marketing than most other tourism boards, by running separate accounts from multiple Chinese cities. In 2019, Tourism Authority of Thailand accounts ranked 4th, 5th, and 7th in the full-year WeChat Rankings – in 2018, they were 4th, 6th, and 8th. If the total article views from these three accounts for 2019 were combined, Thailand would still take second place behind Japan, with nearly three times as many articles. France improved its ranking slightly, up to 6th from 7th in 2018.
North America had a challenging year for Chinese tourism, with arrivals down for both the US and Canada. Their respective tourism board accounts on WeChat both declined, too. Part of this was due to a marketing freeze for Canada at the start of 2019 – the account posted 60% less in 2019 than the previous year, and average views per article were down, too. Meanwhile, Brand USA’s account dropped from 10th to 14th place in 2019. That said, both Canada and the US recovered slightly by the end of the year, with Canada in 7th for Q4 and the US up to 9th.
WeChat Rankings have been very slow to reflect the diversification of Chinese outbound tourism destinations, and 2019’s top 20 list still only includes one African country – South Africa this year, instead of Kenya in 2018. Slovenia made it to 8th place for the year, and 4th for Q4, but we still have reservations about the account’s staggeringly above-average article likes and how this is affecting viewership. In Q3 2019, Peru became the first-ever Latin American country to be ranked in the top 20 national tourism boards on WeChat for the quarter, and they made the list once again in Q4 2019, ranking 23rd for the year.
DMOs
 Looking at the rankings for the full year, WeChat performance for municipal and regional tourism boards has shifted around slightly – but the Q4 rankings show more dramatic changes.
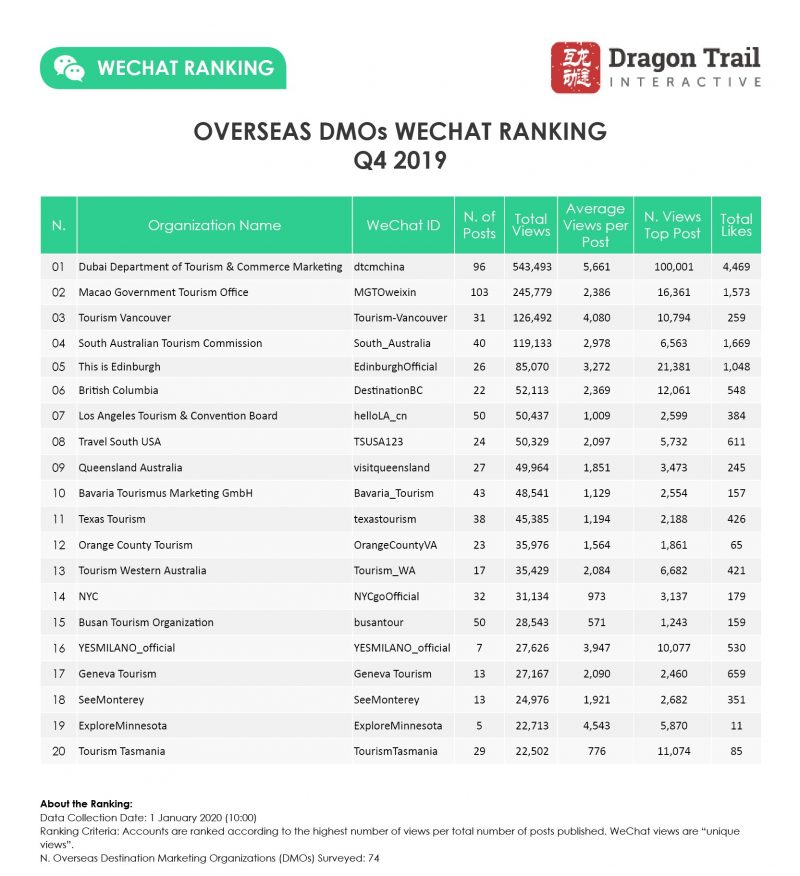
For 2019 as a whole, Hong Kong has only dropped from 2nd place in 2018 to 3rd. But with only two articles published in Q4, the city’s tourism board slipped from 4th place in Q3 to 31st in the last quarter of the year.
Moving up from 20th place in 2017 to 5th in 2018, Vancouver continued its upward momentum on WeChat, landing in 4th place for the full year. It ranked 3rd for the second half of 2019, however. South Australia also had a good year, leveraging its ongoing partnership with celebrity Huang Xiaoming to reach 5th place in 2019 (up from 6th in 2018), and 4th place for Q4.
Edinburgh remains Europe’s leading DMO account, in 10th place for the second year in a row. The tourism board had its best quarter ever in Q4, ranking 5th. European DMOs in general made a stronger showing in the WeChat Rankings, with four accounts in the top 20, up from just two in 2018. The newcomers were Bavaria and Geneva, with Zurich also up one place from 2018. Europe’s gain was North America’s loss, however – the US went from eight accounts in the top 20 to seven in 2019, and Canada from three to just two.
Airlines
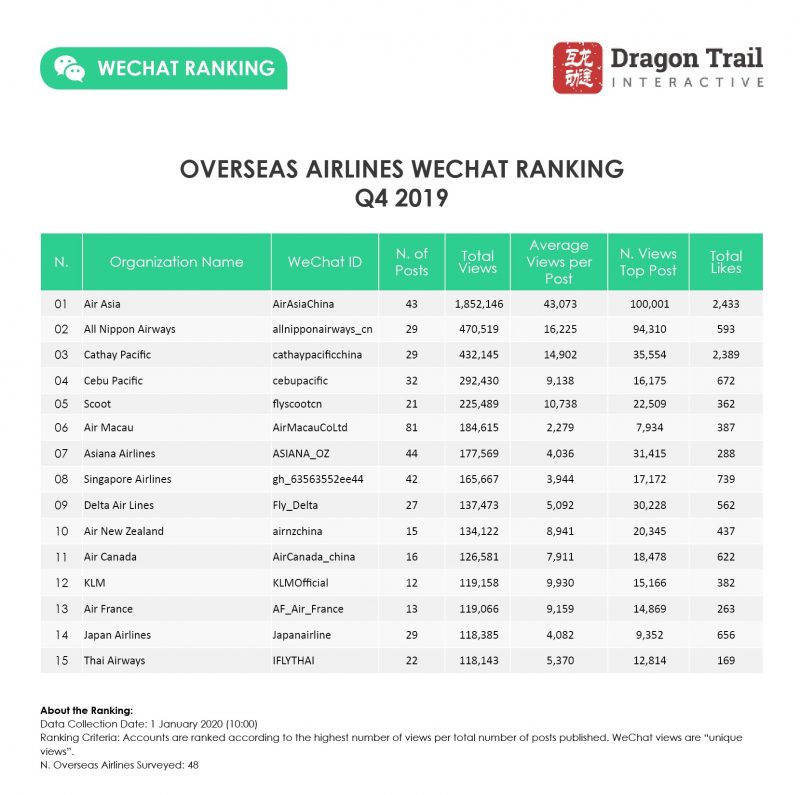
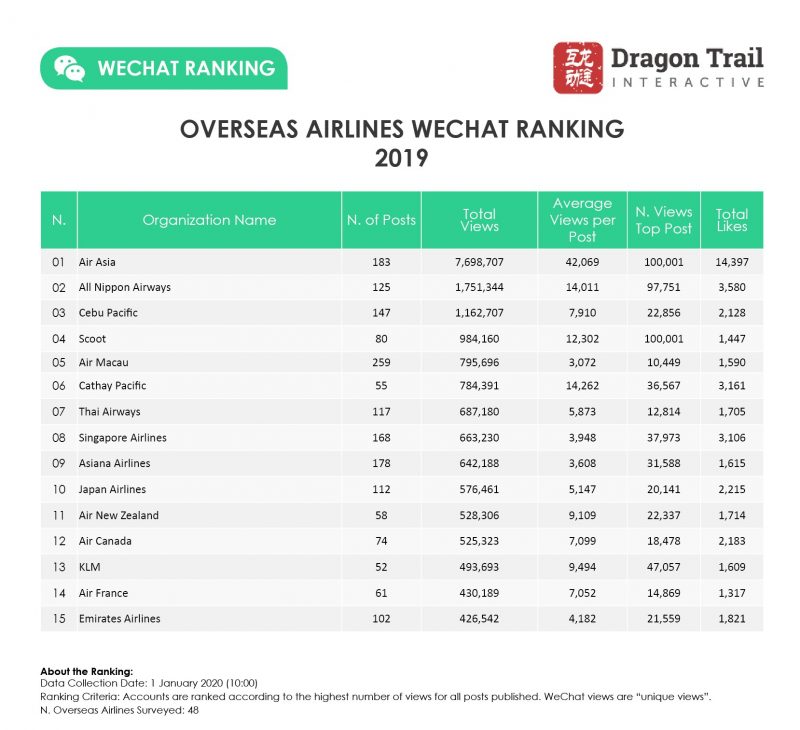 The top three airline accounts for 2019 were the same as in 2018: AirAsia, All Nippon Airways, and Cebu Pacific. The next three accounts (Scoot, Air Macau, and Cathay Pacific) just shifted their order slightly from the year before. AirAsia consistently dominates this category, with more than four times more article views, and nearly three times more average article views than any other account. However, All Nippon Airways did expand its WeChat presence in 2019, with a 28.9% increase in total article views, and a 13.4% increase in average article views.
Below the top six are also some interesting developments. In 2018, only four of the top 15 airline accounts were not East Asian brands. In 2019, this has expanded to five, with Air France and Emirates Airline joining Air New Zealand, Air Canada, and KLM.
United Airlines dropped down from 8th place in 2018 to 18th in 2019. But one US airline had a very good end to the year – Delta, which ranked in 19th or 20th position for the first three quarters, jumped up to 9th for Q4, without increasing its number of posts. Delta’s end-of-year content included a number of sales and giveaways.
Cathay Pacific picked up on WeChat at the end of the year, in 3rd place for Q4, and with the second highest average views per post for the year.
Cruise Lines
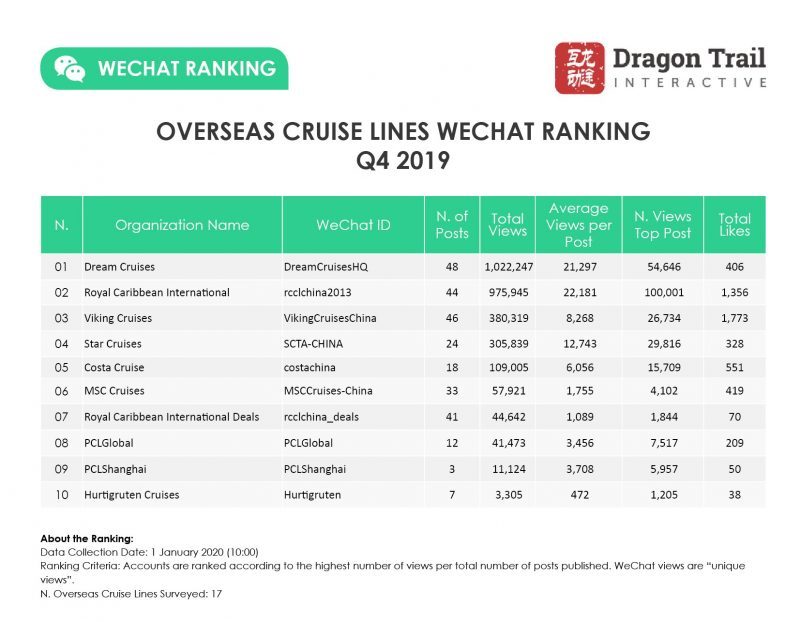
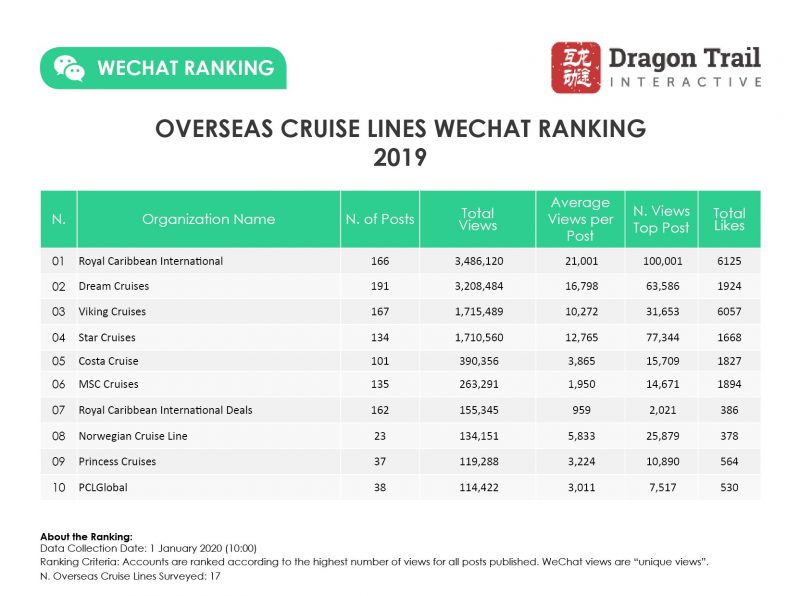 Ranked in second place for the full year, Dream Cruises really pulled ahead in 2019, first surpassing Viking Cruises and now drawing in very close to Royal Caribbean. Both accounts had more than 3 million views in 2019 – compared to Dream Cruises’ 861,565 in 2018.
Royal Caribbean’s Deals account has dropped down from 2nd place in the 2017 rankings to 6th in 2018 and 7th in 2019. However, average views per article for the account have continued to grow over this time. The account posted 42.5% less in 2019 as the previous year though, while the number of posts for the main Royal Caribbean account remained the same.
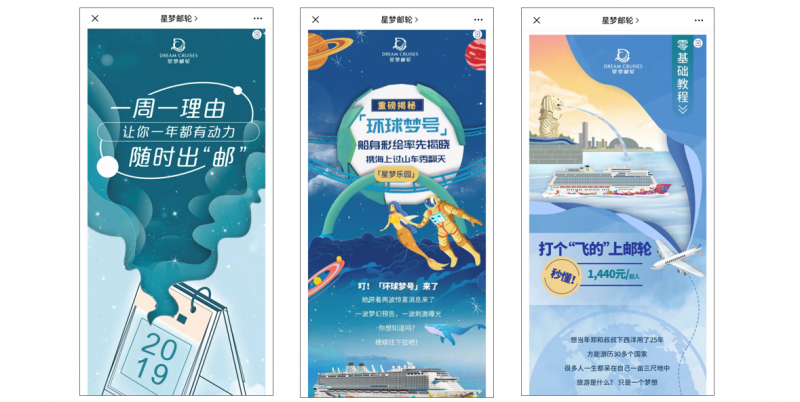 Dream Cruises made major gains on WeChat in 2019
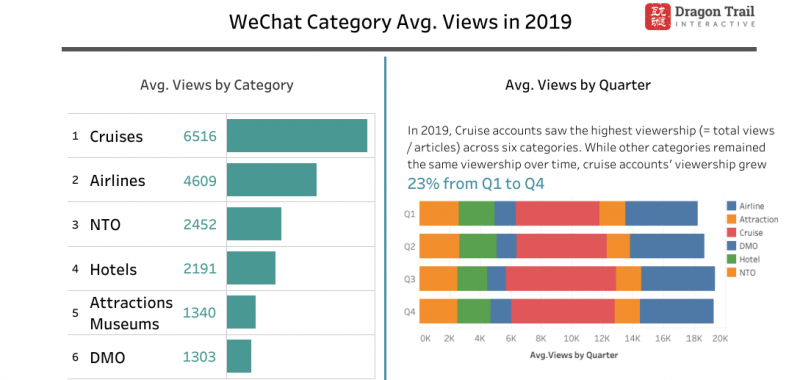
Overall, cruises were the category with the biggest gains in average article viewership in 2019. This was led by Dream Cruises, but all four top cruise lines, including Royal Caribbean, Viking Cruises, and Star Cruises, made significant gains in article views over the past year. While this shows maintained or even growing interest in cruise travel from China, which has stagnated a bit over the past several years after a period of intense growth, it may also be a reflection of reduced competition. With Norwegian Cruise Line leaving the Chinese market and abandoning its WeChat marketing in the spring of 2019, this leaves space for other brands to fill.
Museums and Attractions
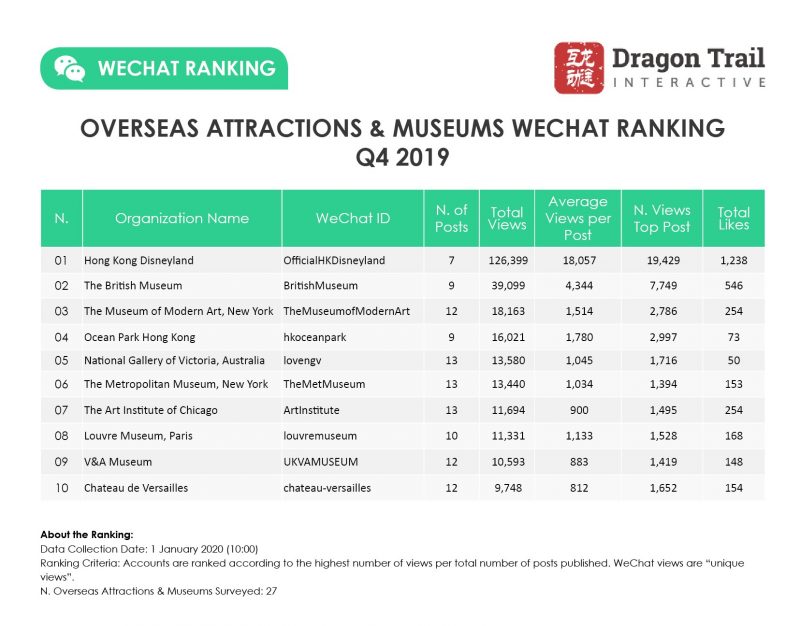
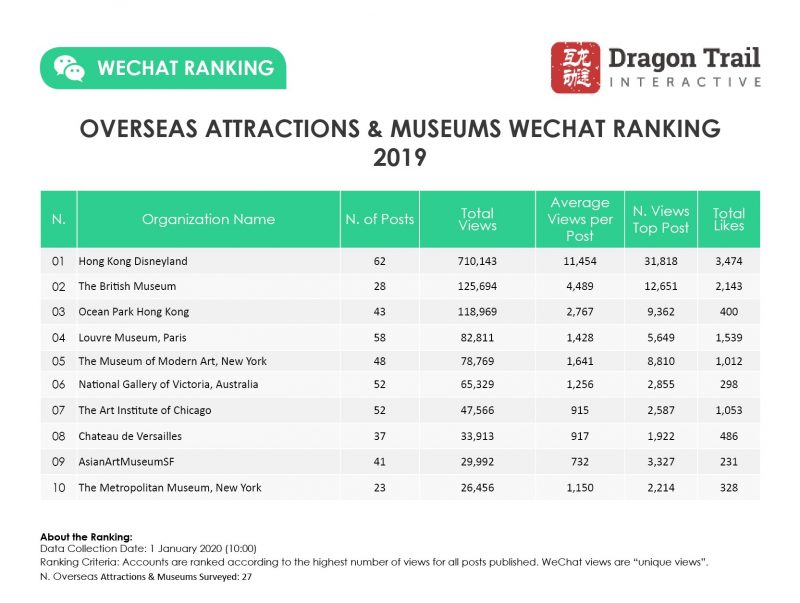 Despite posting very infrequently during the last half of the year, the popularity of Hong Kong Disneyland and its presumably very high follower numbers meant that this attraction ranked number one by both total article views and average article views for each quarter of 2019. Another Hong Kong theme park, Ocean Park, however, dropped in the full-year rankings from 2nd place in 2018 to 3rd in 2019, and ranked 4th in Q4 2019. Both Hong Kong Disneyland’s and Ocean Park’s visitor numbers have been significantly affected by the drop in tourism to Hong Kong.
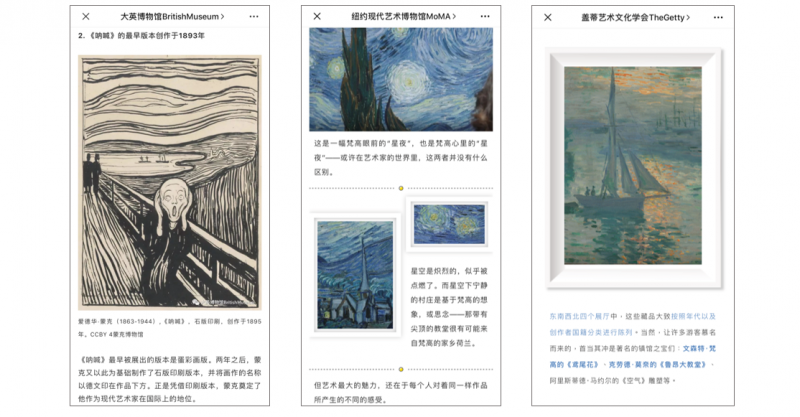 Museum accounts like (left to right) the British Museum, the Museum of Modern Art, and the Getty Center all saw substantial increases in average views for WeChat content in 2019
Almost all of museums on this and last years’ top 10 lists increased their average article views on WeChat in 2019 compared to 2018, some more dramatically than others. The National Gallery of Victoria was quite stable, with a 3.2% increase in average views. The Louvre’s average views per post were up 16.7%. The British Museum, which ranked in 2nd place for the full year, up from 6th in 2018. The London museum increased average article views by 57.6% since last year, and had the second-highest average views per post after Hong Kong Disneyland. The Art Institute of Chicago increased average views by 69.4% in 2019, and the Getty Center increased average views by 85.5%. Most impressive was New York’s Museum of Modern Art, which had an especially strong content campaign leading up to the museum’s post-renovation reopening in October, and increased average article views by 107.7% this year. This nearly universal increase in museum-related content (Versailles was down 2.3%) on WeChat corresponds with Chinese travel website Mafengwo’s data about the rising interest in museums by Chinese tourists, as well as anecdotal information from museums about this phenomenon.
Hotels
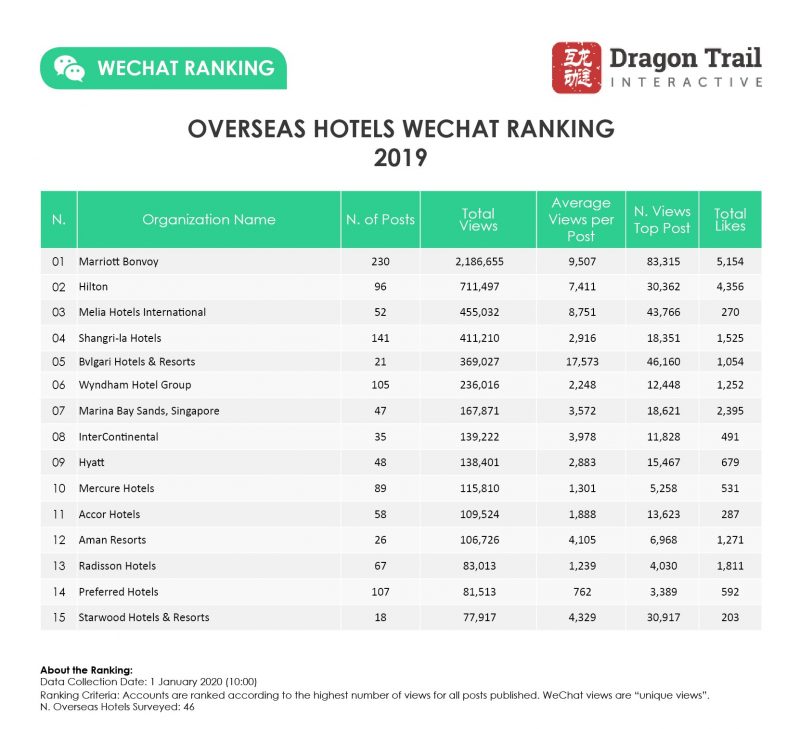
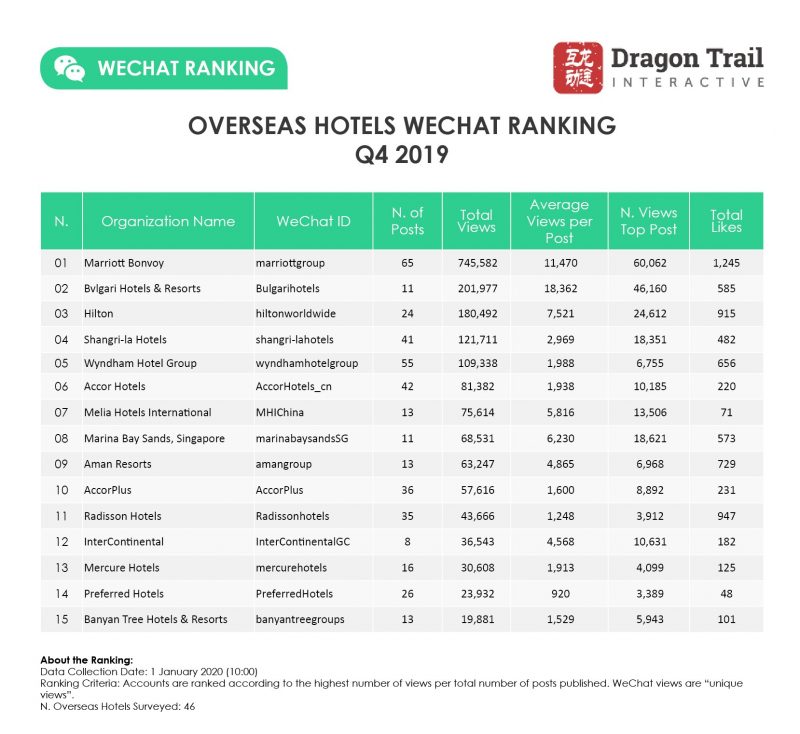
In 2018, the hotels category was dominated by Marriott and Starwood. Following the merger of the hotel groups, it’s unsurprising that Marriott Bonvoy’s WeChat account is firmly at the top of the category for 2019. The account got more than 2 million views in total, over three times the amount of Hilton Hotels, in 2nd place. Marriott Bonvoy also had a higher average view per post than either the standalone Marriott or Starwood account did in 2018. Throughout the year, the hotel group published a well-balanced mix of travel guides to different Chinese destinations with Marriott properties, some inspirational information about overseas properties, promotions for F&B and wedding services, and regular giveaways, including one that was co-branded with aspirational lifestyle platform Xiaohongshu. During the summer months, Marriott Bonvoy also published many articles related to family travel.

Top hotel accounts like (left to right) Hilton, Marriott, and Bulgari, all use different strategies and branding on WeChat
In 2nd place, Hilton also increased average article views, but only published 96 articles compared to Marriott’s 230. The weekly posts by the hotel chain generally only included two or three articles, where Marriott publishes a whole collection of around six per post. Hilton’s content also includes a mix of outbound inspiration and domestic F&B promotions, but with a stronger emphasis on members’ benefits.
With much higher average views per post than any other account, Bulgari Hotels only publishes one article per post, focusing on opulence and domestic properties, with a strong emphasis on fine dining. They’ve also worked with several Chinese celebrities throughout the year. Their November 13 article, featuring a short video and numerous gifs of a glamorous bar show in Shanghai was especially popular, with more than 46,000 views.
Article Themes and Styles
In 2018, food, flowers, and celebrities were the top themes for WeChat content. In 2019, the topics have been more varied, but nature, especially destination articles about seasonal beauty, have stood out. In the first half of the year, romance was also a particularly hot topic. Top accounts Japan and Dubai both cover a wide variety of themes, with guides tailored to different activities (e.g., shopping or hot springs) or demographics (e.g., older travelers, or traveling with children). Australian accounts, on the other hand, have struck gold with post after post about cute local animals, including videos of koalas and kangaroos, and photos of wallabies and quokkas.
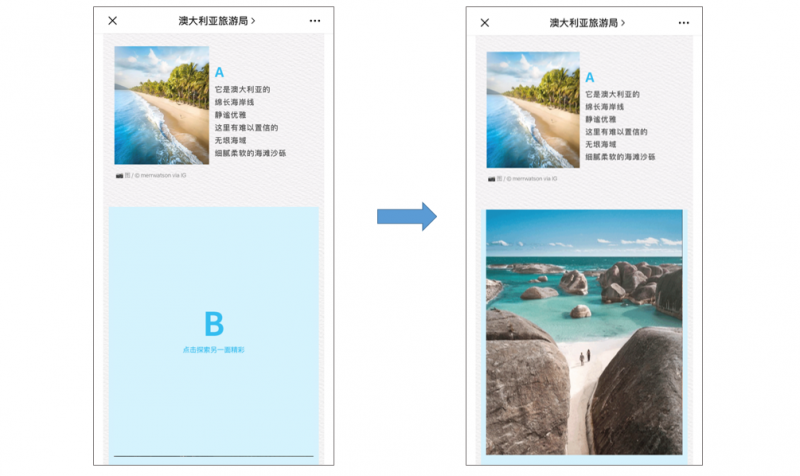
In Tourism Australia’s November 2019 post, readers had to tap their phone screens to reveal hidden pictures
This year, WeChat article design and technology became more sophisticated than in past years. We saw more short videos and gifs embedded in posts. There were also more articles that required you to turn your phone horizontally in order to scroll through long pictures or interactive scenes. Interactivity certainly got readers engaged, such as a fun, interactive quiz and game from AirAsia for Children’s Day to find out how childish you are, with a chance to win prizes. Tourism Australia had very successful post right at the end of the year where readers needed to tap different parts of the article in order to reveal hidden images – this kind of layout is becoming more and more common, and is obviously popular and engaging with WeChat users.

Horizontal and game-like posts were fresh and engaging in 2019. This interactive animation was published by the Hong Kong Tourism Board
Q4 2019 Rankings Charts
The wonderful partners we work with


Sign up for our free newsletter to keep up to date on our latest news
We do not share your details with any third parties. View our privacy policy.
This website or its third party tools use cookies, which are necessary to its functioning and required to achieve the purposes illustrated in the cookie policy. If you want to know more or withdraw your consent to all or some of the cookies, please refer to the cookie policy. By closing this banner, scrolling this page, clicking a link or continuing to browse otherwise, you agree to the use of cookies.